INSIGHTS 101 - Search insights and optimization tools
Introduction
This course is aimed at communications and marketing professionals and takes you through the features available in the Funnelback search interface and the reporting and tools provided by the Funnelback insights dashboard.
Each section contains:
-
A summary: A brief overview of what you will accomplish and learn throughout the exercise.
-
Exercise requirements: A list of requirements, such as files, that are needed to complete the exercise.
The exercises can be read as tutorials or completed interactively. In order to interactively complete the exercises you will need to set up the training searches, or use a training VM. -
Detailed step-by-step instructions: detailed step-by-step instructions to guide you through completing the exercise.
-
Some extended exercises are also provided. These exercises can be attempted if the standard exercises are completed early, or as some review exercises that can be attempted in your own time.
The search insights dashboard
Overview of the insights dashboard
The insights dashboard is primarily targeted at non-technical users that are concerned with the reporting functions within Funnelback. This interface also enables users to maintain Funnelback’s best bets, synonyms, curator rules and training data for automated tuning.
The insights dashboard can be accessed standalone and will also launch automatically when certain editing functions for results pages are selected within the administration interface.
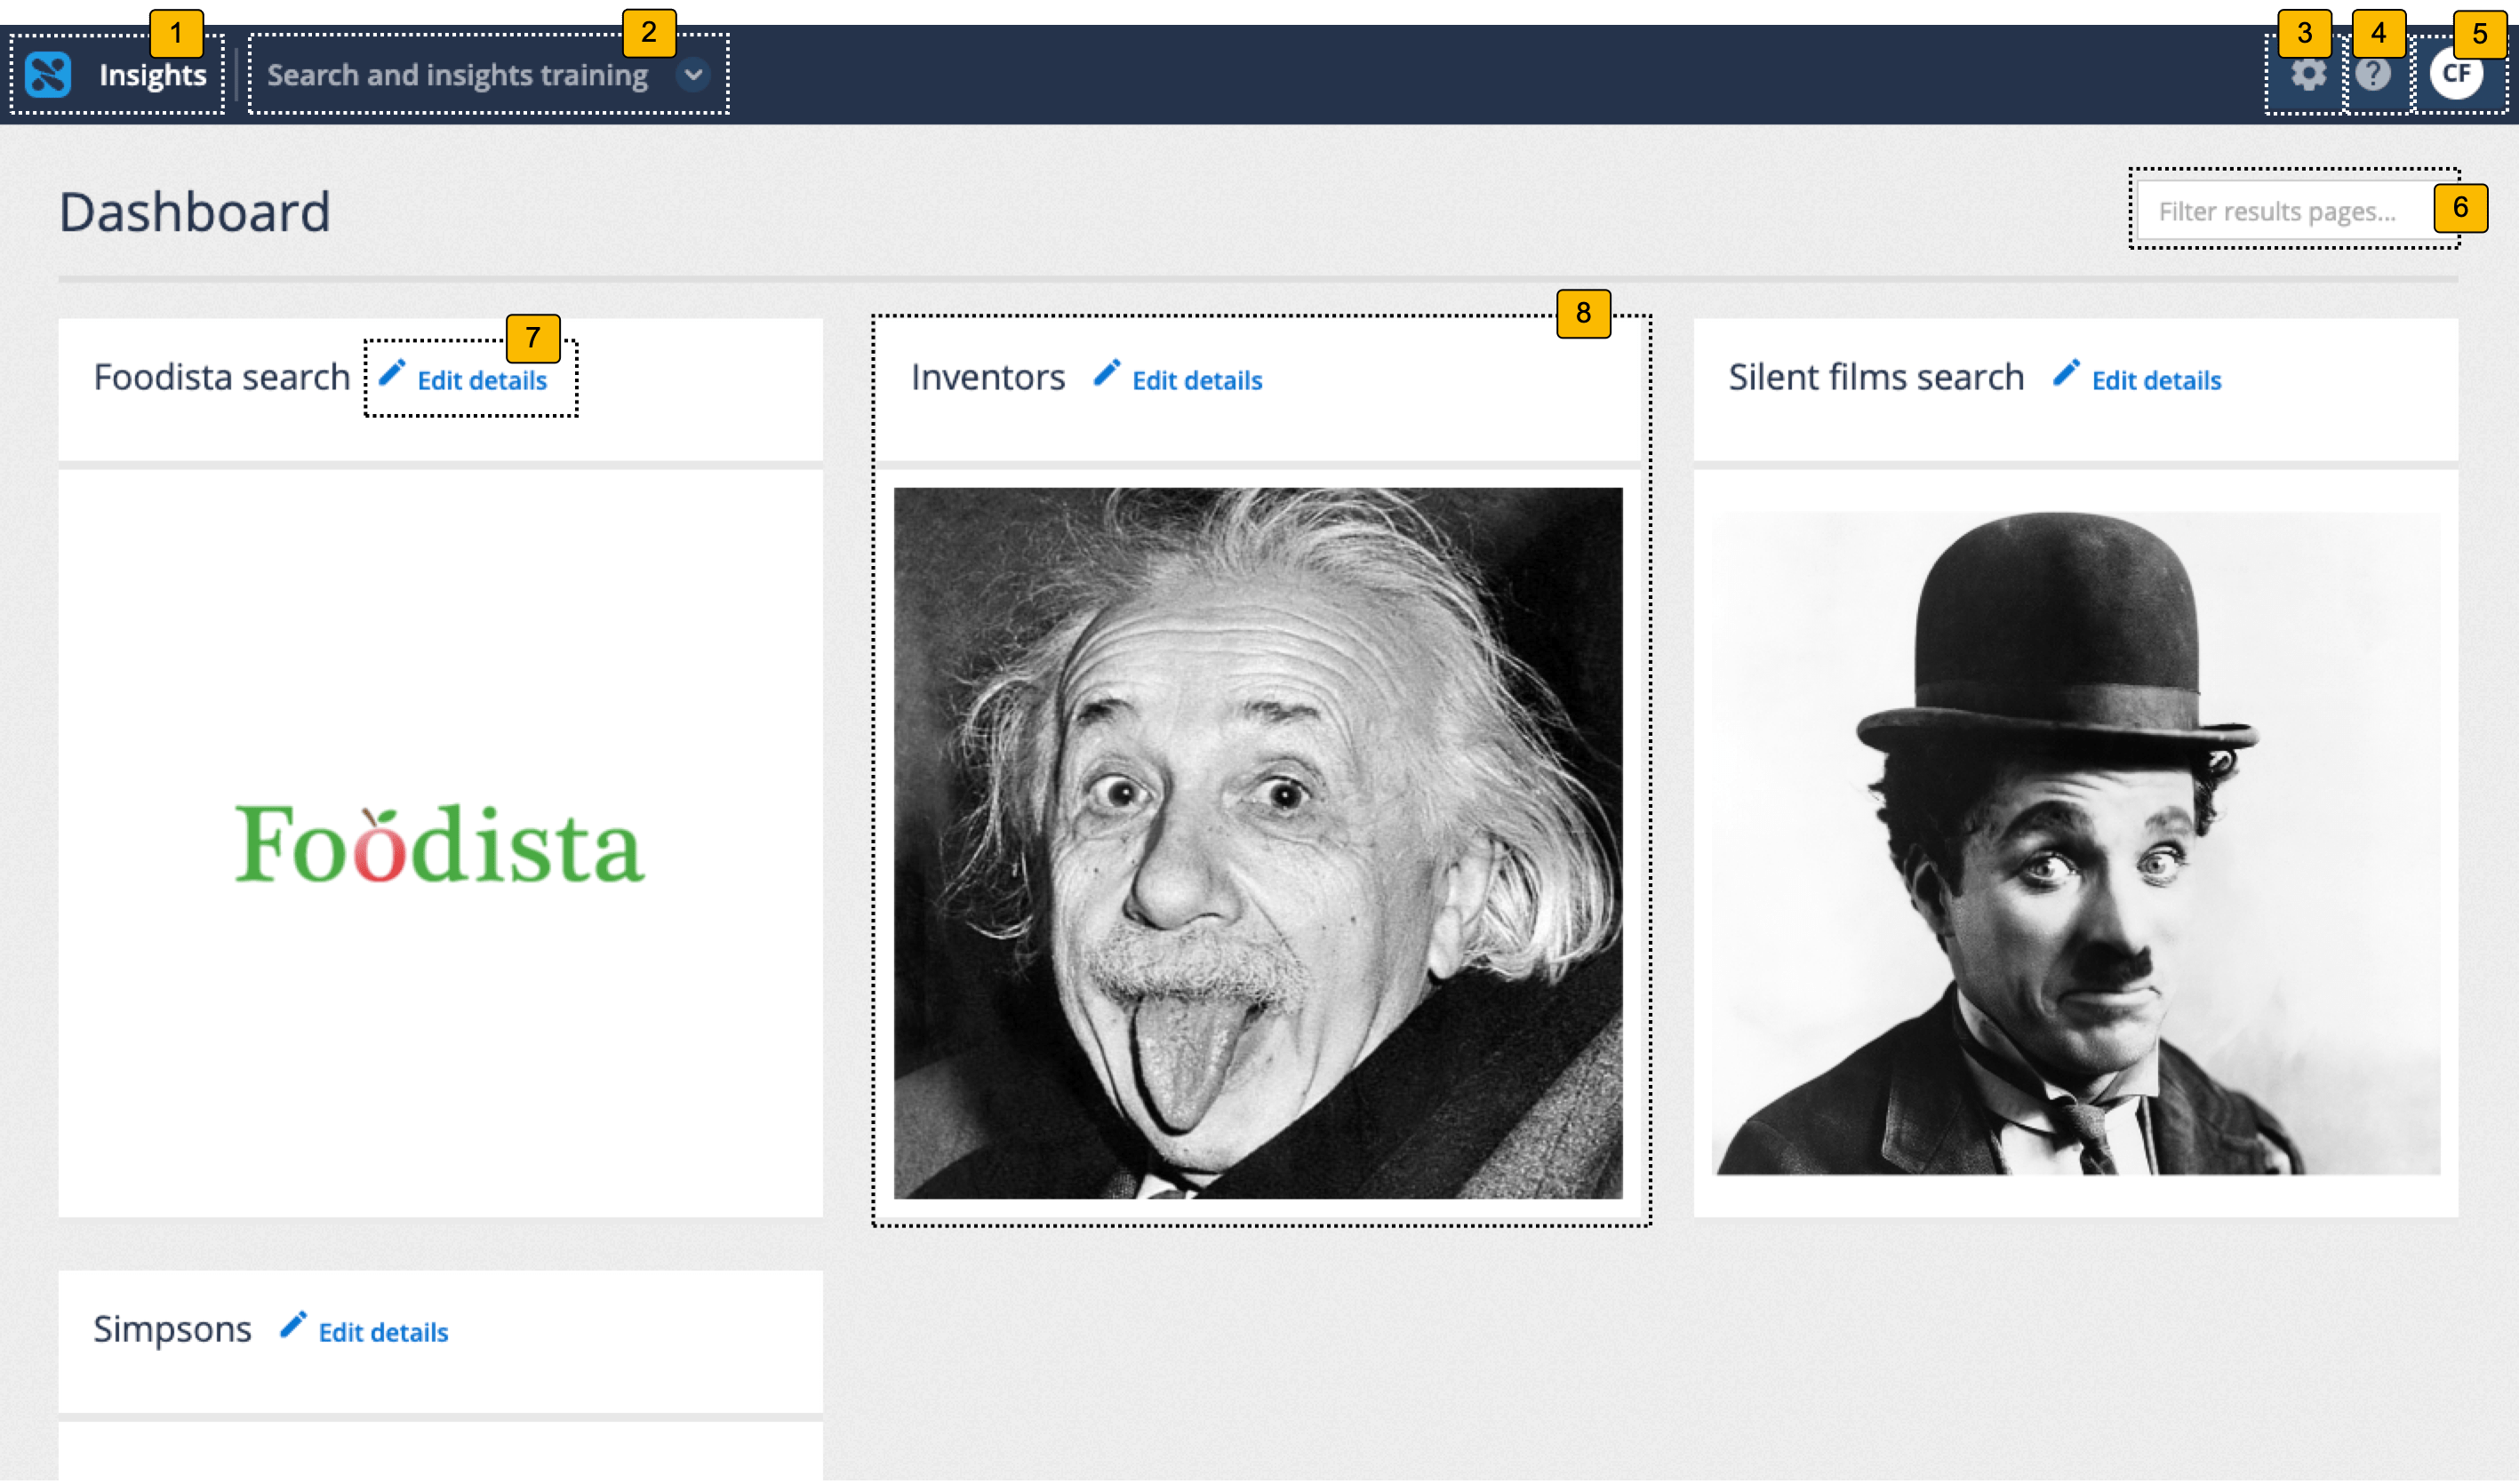
insights dashboard home screen
The insights dashboard home screen is composed of several features, which perform different functions. These include:
-
Dashboard switcher: Switches between the administration and insights dashboards.
-
Client switcher: Switches between available clients.
-
System configuration menu: Provides access to system configuration functions and also the API UI.
-
Online help: Opens the Funnelback online documentation.
-
User profile: Opens a menu that provides access to your user profile and also the ability to log out of the search dashboard.
-
Filter results pages: Filters the results pages displayed as tiles below to include only those where the filter string matches within the name.
-
Edit details: Provides options to change your results page name and thumbnail image.
-
Results page tiles: Opens the insights dashboard for the results page.
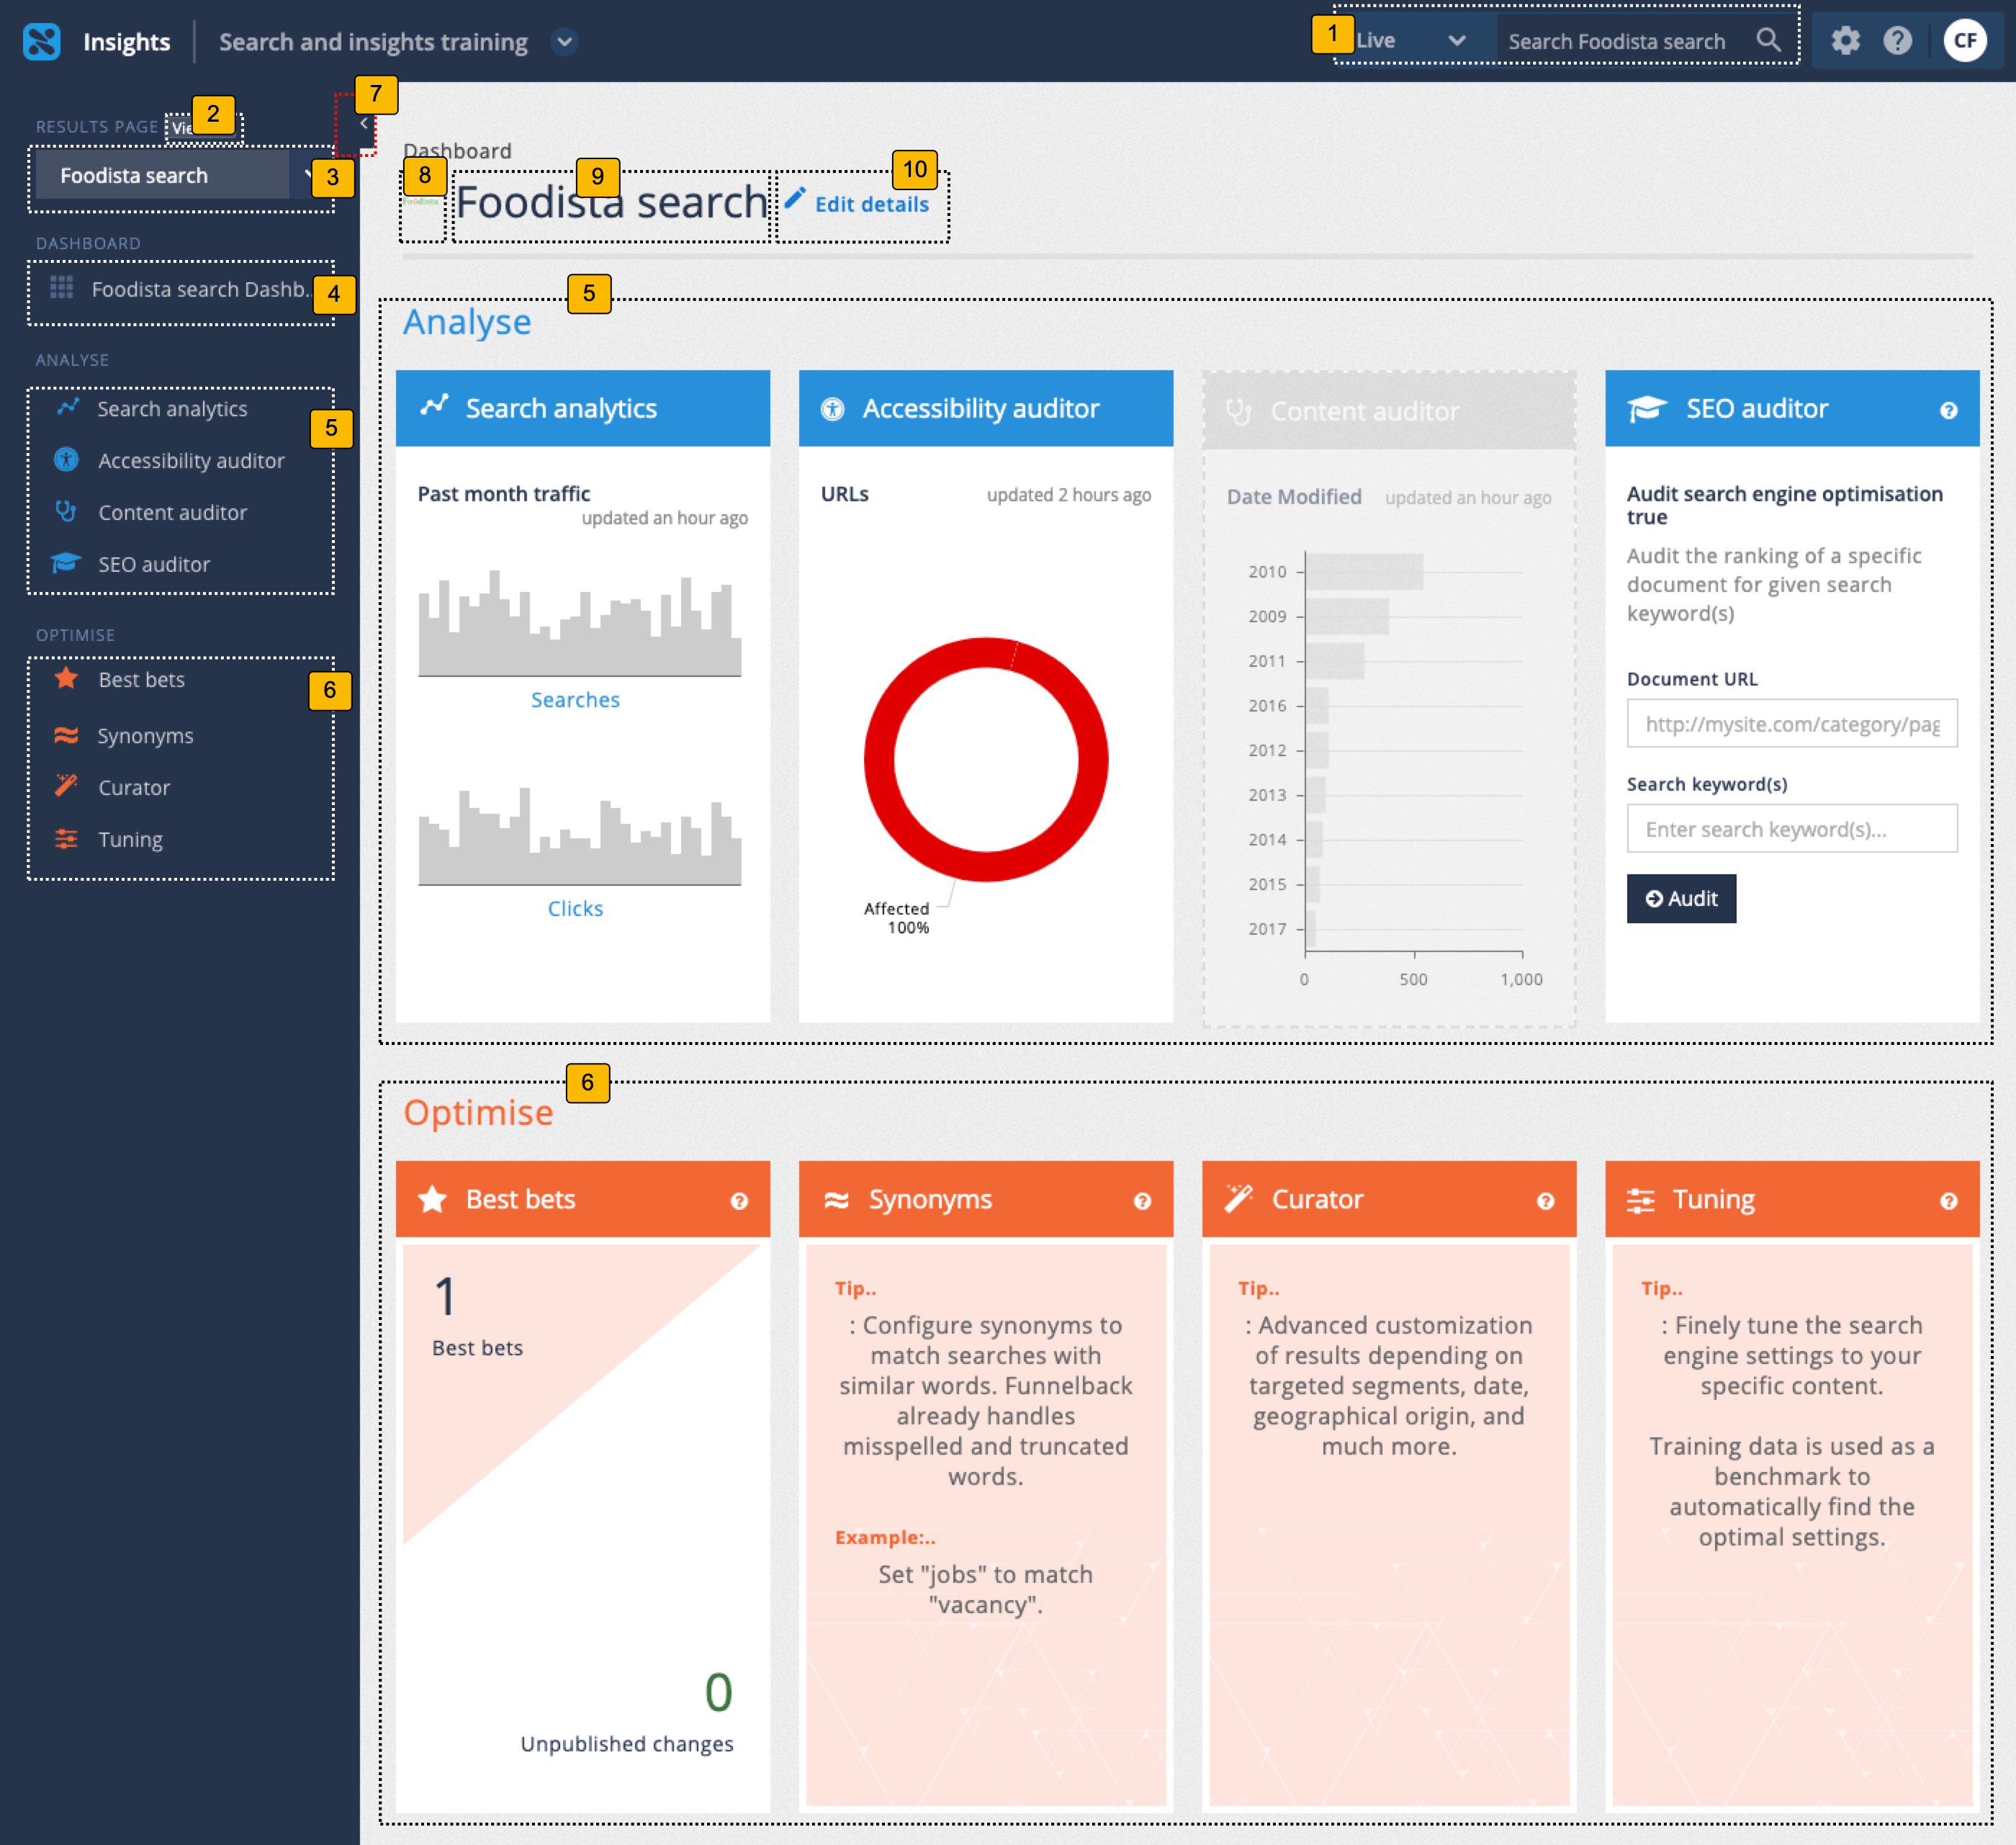
Insights dashboard manage specific results page
Selecting a results page tile from the insights dashboard overview screen opens a dashboard for optimizing and analyzing the selected results page.
-
Quick search box: allows a search to be run against the current results page in preview or live mode. The Funnelback insights dashboard provides the ability to preview any changes made using the available optimization tools. This allows best bets, synonyms and curator changes to be made and viewed without the live search being affected. The changes are then published to make them visible on the live search.
-
Display all available results pages: returns to the insights dashboard overview screen that lists the available results pages as tiles.
-
Results page switcher: quickly switch between available results pages. Listed results pages are the same as on the insights dashboard overview screen.
-
Return to results page dashboard: indicates the current results page and clicking returns the user to the results page dashboard for the current results page.
-
Analyze tools: menu of available analysis tools for the current results page.
-
Optimize tools: menu of available optimization tools for the current results page.
-
Show/hide menu: Clicking this button shows and hides the left hand menu.
-
Thumbnail for the current results page
-
Name of the current results page: indicates the current results page.
-
Edit details: Provides options to change your results page name and thumbnail image.
The main area of the results page insights dashboard provides access to all the analysis and optimization tools and displays a tile for each containing a summary of the tool.
Analysis tools
The analysis tools of the insights dashboard provide insight into both search user behavior, and the underlying content available to Funnelback.
- Search analytics
-
View reports on queries and what people have clicked on - allows you to drill-down by date and export to various formats.
- Accessibility auditor
-
View accessibility auditor reports.
- Content auditor
-
View reports on metadata, duplicates and other content features.
- SEO auditor
-
Display information on how to improve the ranking of a particular document for a particular query.
Optimization tools
The optimization tools of the insights dashboard provide the ability to refine result pages in a range of ways, to improve the search user’s experience.
- Best bets
-
Specify best bets for key queries, to ensure users see the results you want them to.
- Synonyms
-
Control how some queries are interpreted to match up with your organization’s terminology.
- Curator
-
Customization of result pages for specific queries.
- Tuning
-
Optimize the ranking your search results by training the ranking algorithm.
Tutorial: Accessing the insights dashboard
-
Log in to the insights dashboard where you are doing your training.
See: Training - search dashboard access information if you’re not sure how to access the training. Ignore this step if you’re treating this as a non-interactive tutorial. -
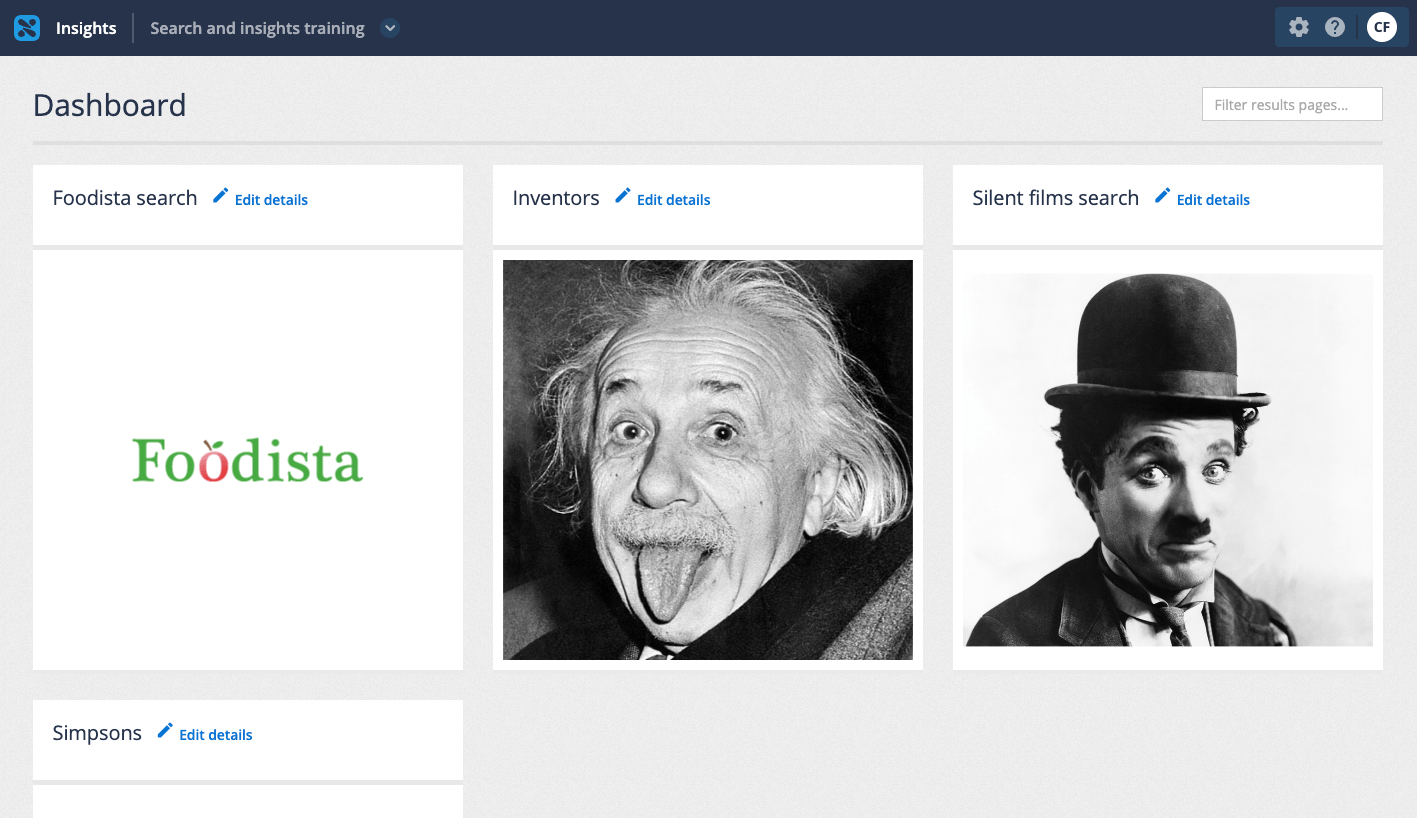
The insights dashboard home screen will be displayed. There are four pages displayed - for the inventors, silent films, Simpsons and Foodista.
-
Click on the Foodista tile to access the dashboard for the Foodista results page. A dashboard display appears for the results page with tiles for each of the available tools.
Understanding your search
Search analytics reports
Search analytics reports provide valuable insight into the users of a website and the information they seek.
The reports not only tell you what information users expect to find on a website, but also the language that they expect it to describe it and the language they use to describe it.
The key to managing the success of your website is to understand these users - who they are, and what they expect to find on the site.
The analytics reports also provide other insights that help to understand the users in more detail - demographic information that is inferred from the user’s IP address.
This provides information on the where users are located and also information about the user’s industry in many circumstances.
It is also worth noting the added value provided by search analytics when compared with web analytics. Web analytics reports on pages visited by a user, but there is no real way of knowing what the user was looking for based on this. Search analytics provide the actual search terms used as well as the links clicked on - providing a much better picture of what a user seeks.
The search analytics are available via the left-hand menu of the insights dashboard and consists of five different reports:
-
Search analytics overview
-
Searches
-
Clicks
-
Location
-
Trends
Search analytics overview
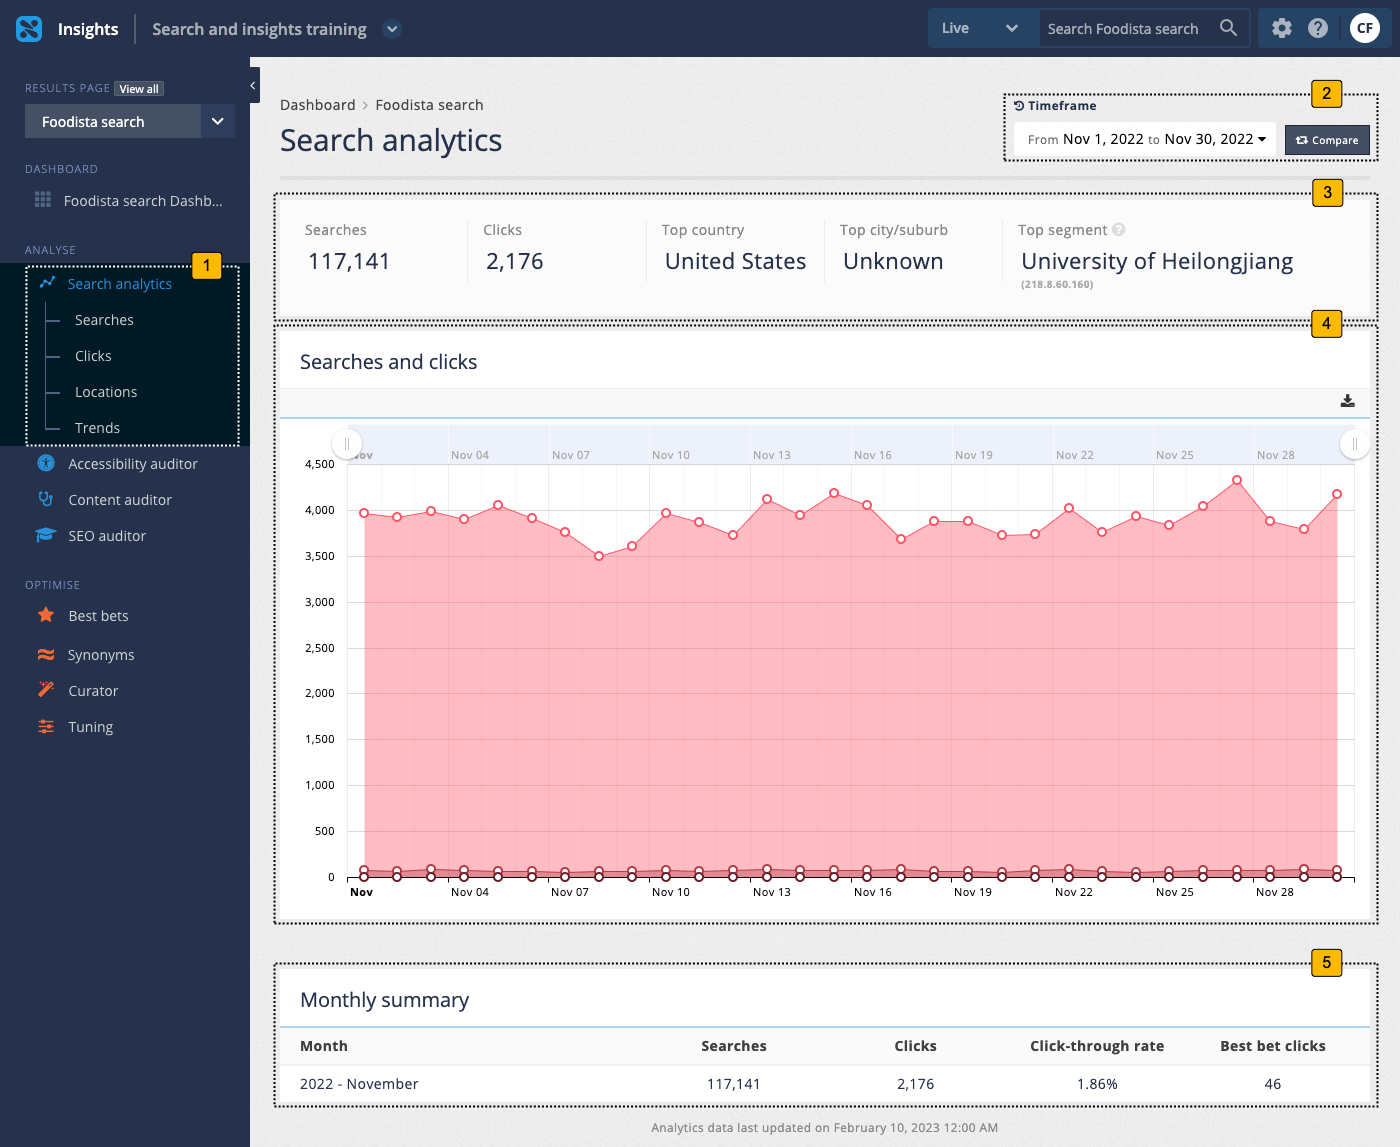
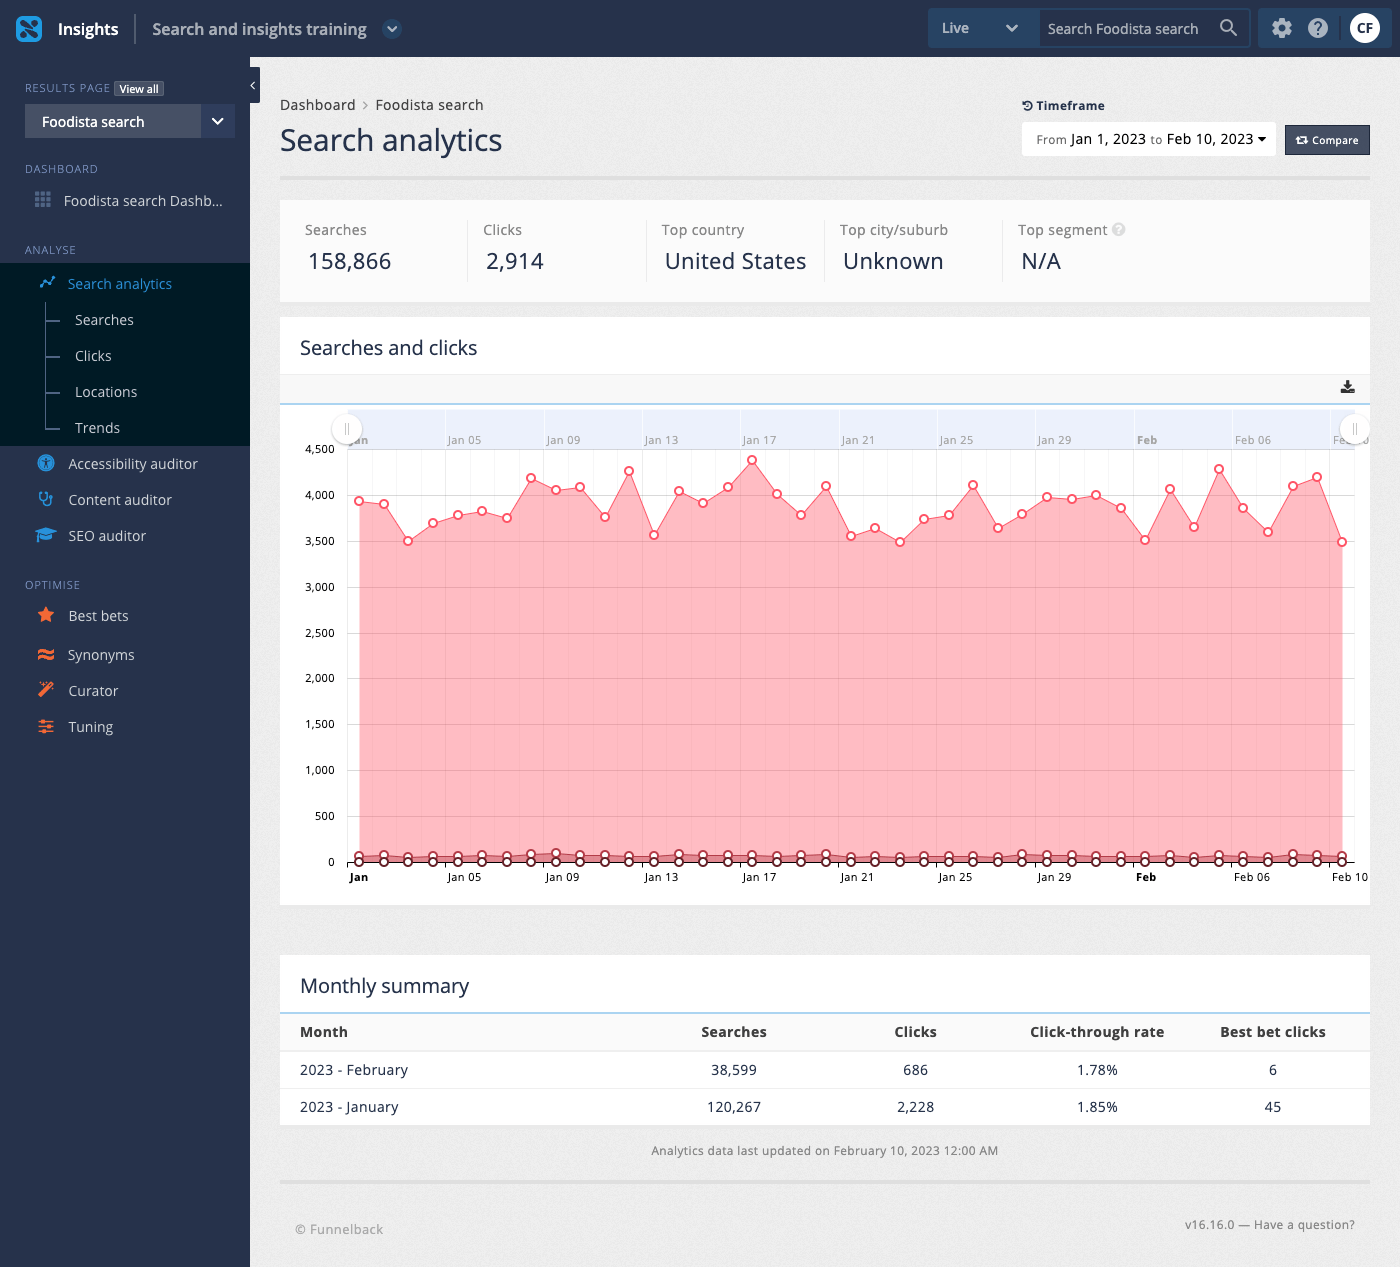
The main search analytics screen provides a summary of search activity on the current service for the specified time frame.
-
Analytics reports sub-menu: Access to the analytics reports.
-
Timeframe and comparison controls: Sets the report and comparison periods.
-
Analytics summary: High level summary for the current timeframe.
-
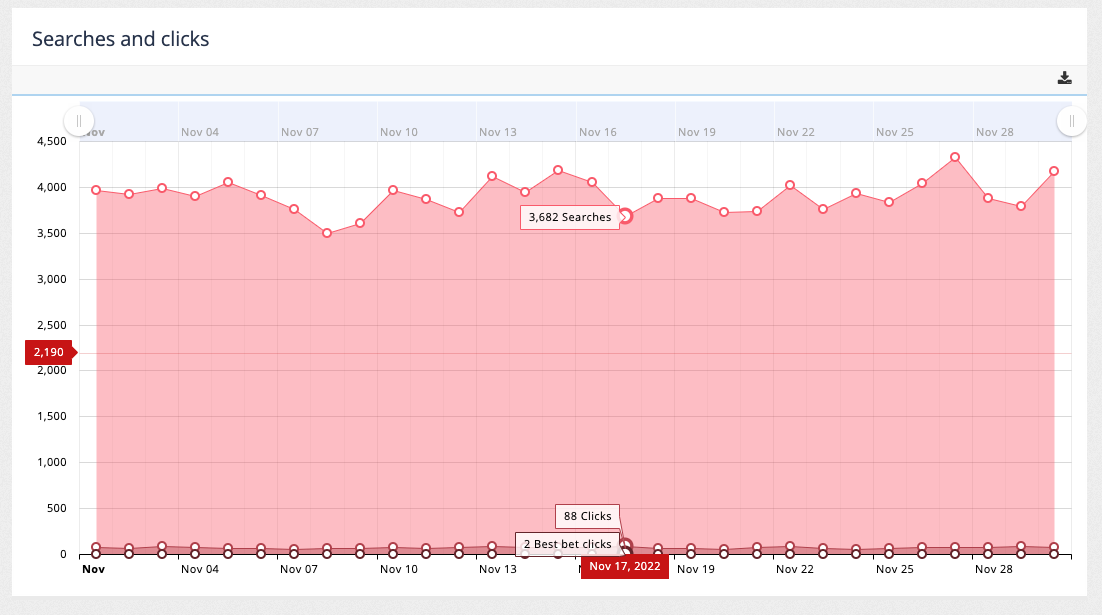
Over-time chart: Day-by-day total searches and clicks.
-
Monthly summary: Month-by-month breakdown of current timeframe(s).
Hovering over the chart provides additional information on the number of searches, clicks and best bets clicks for the given day.
Analytics summary
A summary of the main analytics metrics is displayed at the top of the page. The numbers presented reflect the data for the currently selected time period.

The metrics included in the summary are:
-
Number of searches recorded within the current timeframe.
-
Number of result clicks made during this period.
-
The top country where the most searches originated.
-
The top city/suburb where the most searches originated.
-
The top segment where the most searches originated. The segment is inferred from the user’s IP address, which is compared with a database of public information known about IP addresses. The segment information can include information such as the derived organisation name and industry segment (such as higher education or finance).
Monthly summary
The monthly summary is displayed at the bottom of the page detailing the number of searches, clicks and best bet clicks by month for the current timeframe.

Tutorial: Analytics dashboard
| The analytics data is auto-generated for the training session and will differ from what is shown in the screenshots. |
-
Log in to the insights dashboard and select the Foodista search service.
-
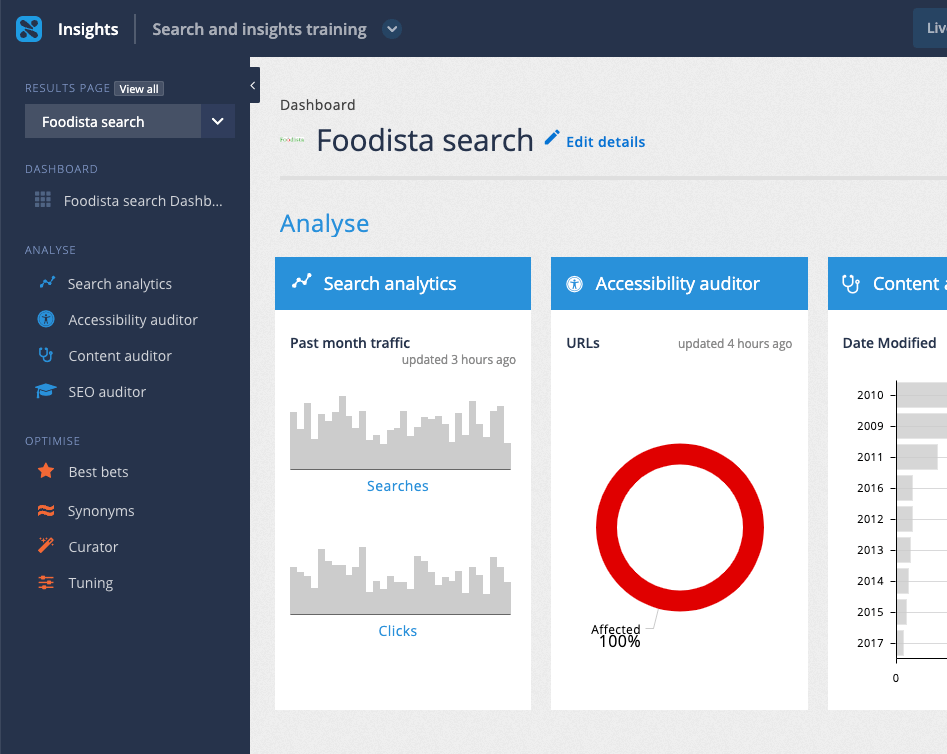
The dashboard displays a search analytics tile that shows the search and click activity for the analytics demonstration over the last month. Load the analytics dashboard by clicking on the search analytics tile, or by clicking on the search analytics link in the sidebar.
-
The analytics dashboard is displayed. Summary data for the current month is displayed by default.
-
Observe the overview summary that provides the main counts for the current report period (the current month).

-
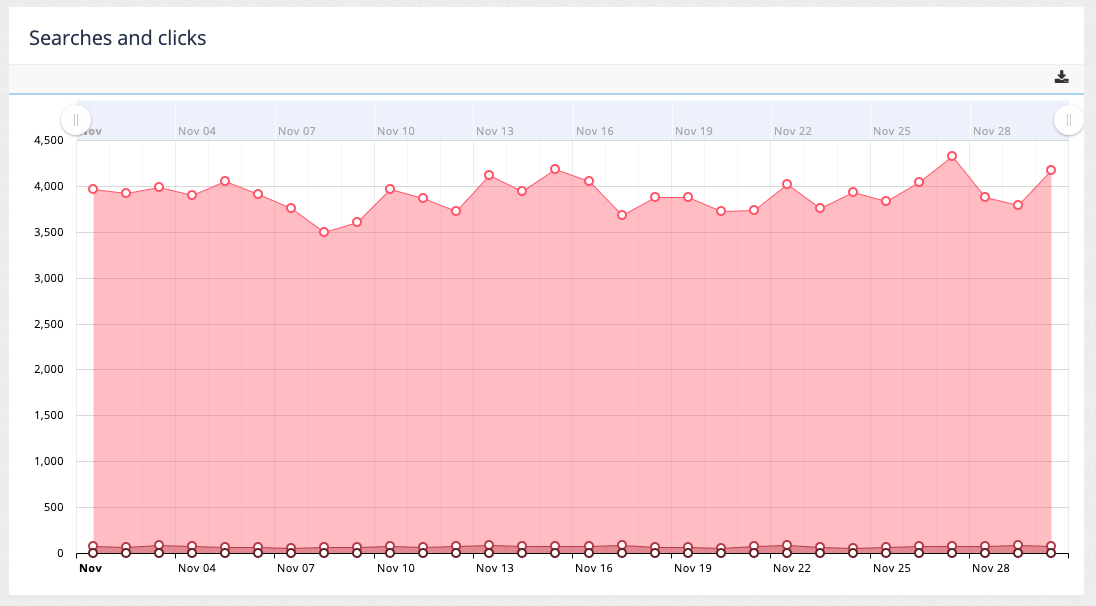
The searches and clicks chart displays day by day totals for searches, search result clicks and best bets clicks.
-
The monthly summary displays a month by month breakdown of searches and clicks.

-
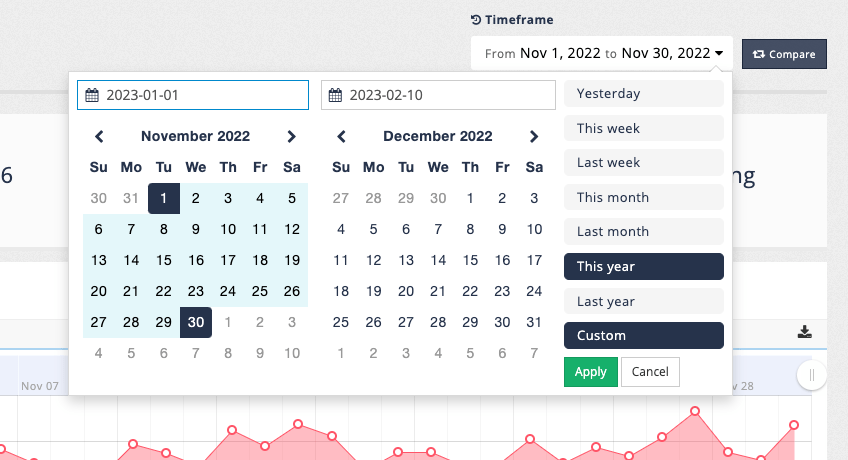
Update the report timeframe to show analytics for this year.
-
Observe that the overall summary, graph and that the monthly summary update with data covering the new timeframe (this year).
Reporting period and comparisons
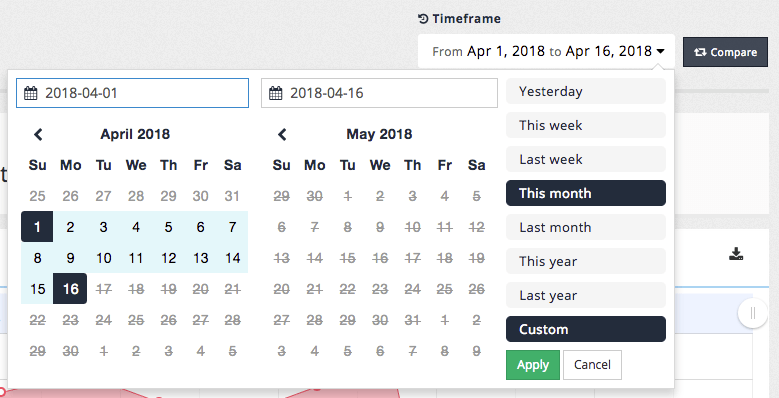
The period of time covered by the analytics reports can be adjusted using the timeframe control located at the top right hand corner of the screen.
The menu allows selection from set a of pre-defined relative time frames, or specification of a custom time period.
The analytics updates automatically when the time frame is changed.
Clicking on the compare button allows you to define a second time frame. This allows for graphs to be produced that compare the analytics over the different time frames.
Tutorial: Analytics comparison
| The analytics data is auto-generated for the training session and will differ from what is shown in the screenshots. |
| When comparing time periods ensure that the time periods selected make sense. For example, a comparison of last month vs last year probably doesn’t provide a valid comparison because the time periods are vastly different in size. |
-
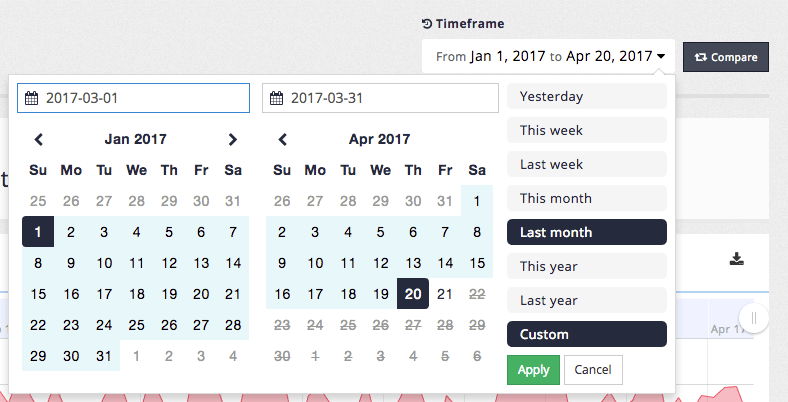
Access the search analytics then change the current timeframe to correspond to show searches for last month by selecting last month from the timeframe menu. Observe that the timeframe updates after the selection is made.
-
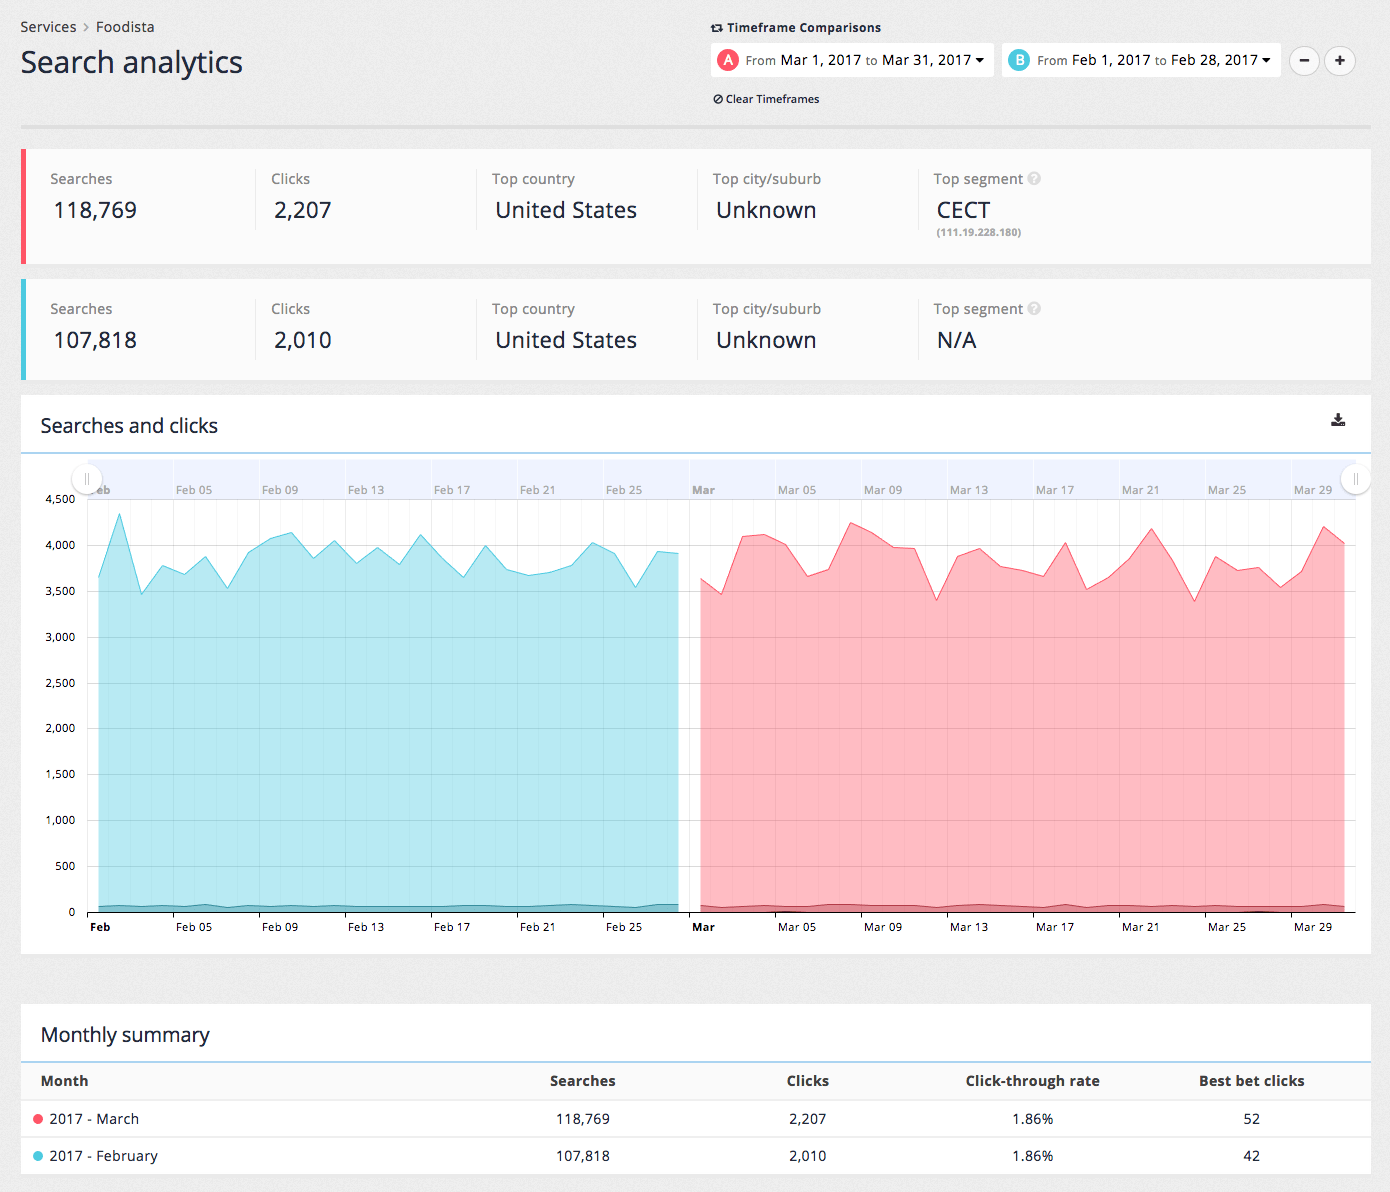
Add a second timeframe clicking on the compare button. Define a custom timeframe for the previous month (i.e. two months prior to the current month) by selecting custom and selecting a start and end date using the calendar controls then apply the timeframe. The report changes to display two sets of analytics side by side:
-
All the analytics screens can be viewed and exported with comparisons being displayed on all the tables and charts.
Additional timeframes can also be defined by clicking the + button.
-
Remove the second timeframe by clicking the - button, leaving only a single timeframe showing.
Searches report
Clicking on the searches item in the menu opens the searches report. The searches report provides information on searches conducted by users of the service.
The searches report covers the most commonly searched keywords, which provides an insight into what the information site users seek and find most important.
The report also examines the top searches that returned no fully matching results. This information is a vital source of information that can be used to improve the experience of users of the search service.
| The counts presented reflect the number of search sessions for the keyword. This ignores any searches for page 2 and above of the search results. |
Searches summary
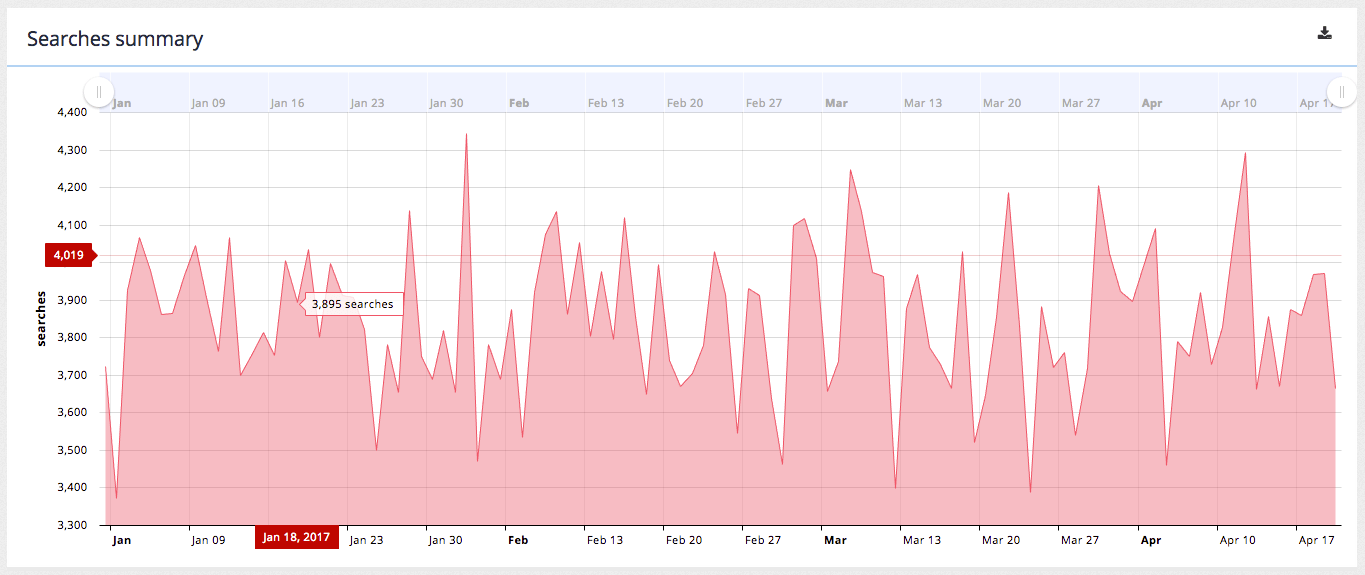
The searches summary provides a day-by-day graph of the number of searches run by users of the search service.
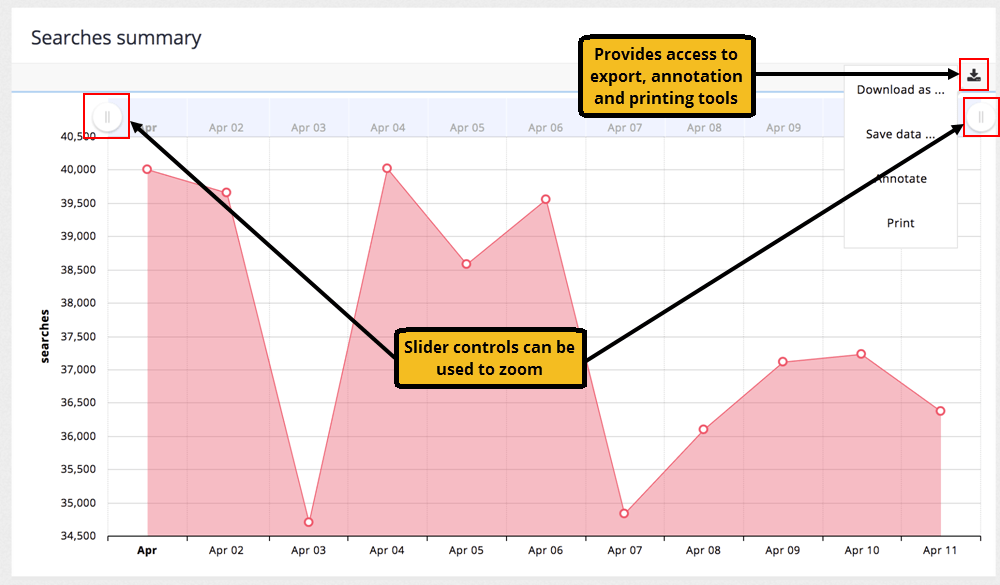
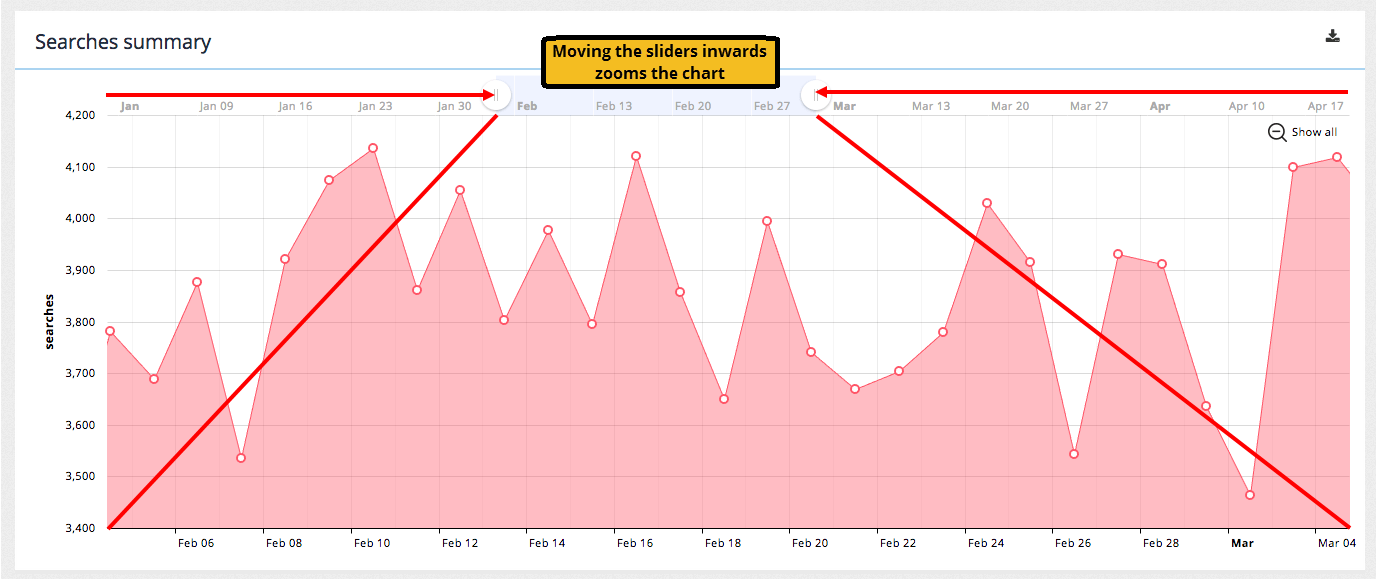
The time period covered can be narrowed (or zoomed) by adjusting the slider controls to the left and right of the header bar on the graph. This provides the ability to zoom in to a smaller period within the graph without changing the time period covered by the report.
Hovering over the data points provides a popup containing the count for the data point.
A control at the top right hand corner of the graph provides a drop down menu containing options to export, annotate or print the graph.
The annotation feature allows you to draw / mark the line graph with notes and annotations that you can then save / export out as necessary.
| The charts can be exported in the following image formats: (PNG, SVG, JPG, or PDF) or data formats (CSV, XLSX or JSON). |
Top keywords
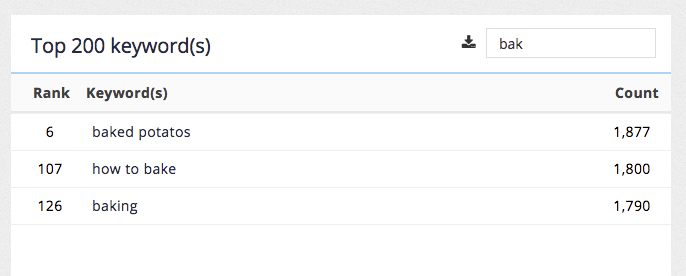
The top keywords report displays the top search terms for the selected period ordered by the number of searches. The filter control allows filtering of the list by a substring.
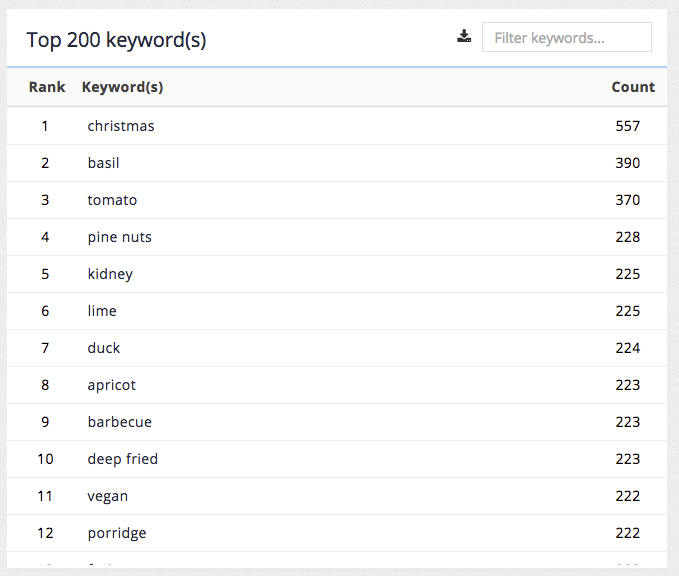
The top keywords report provides the following insights:
-
Popular content topics: The report provides an insight into the topics of most interest to users of the site for the given time period. Over time this can provide a picture of the most important content to maintain on a site.
The data presented here can also be downloaded as a CSV file.
| The analytics report shows the top 200 keywords. If you require more keywords, this can be obtained programmatically via the analytics API. |
Top unanswered keywords
The top unanswered searches report displays popular searches for the selected time period that did not return any fully matching results ordered by the number of searches.
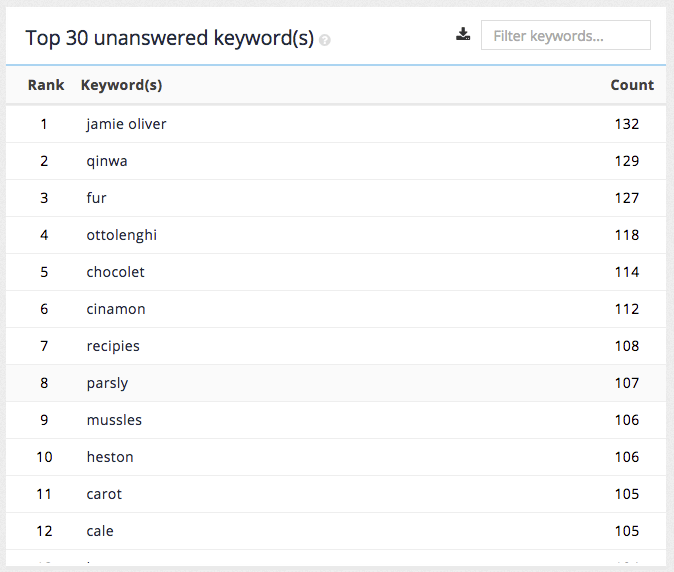
The unanswered keywords report provides the following insights:
-
Words that users of the search commonly misspell: These represent valid searches (if correctly spelled). This information can be used to create a synonym to auto-correct a misspelling.
-
Different terminology to describe content: These represent valid searches, but fail to match any content within the site because the user’s terminology differs from that used in the site content. This information can be used to create synonyms that equate the user terminology to that used on the site.
-
Searches for content that isn’t covered by the site: This can represent valid searches - and can be used to identify information gaps in the site content. Alternatively this can indicate a gap in expectations of what a user perceives should be present on the site. In this case a best bet could be created that presents a result item that directs the user to a website that contains the content for which they are searching.
|
You will sometimes see keywords listed in the unanswered keywords report that also appear in the top keywords report. This can happen if the keyword was previously unanswered in your search results and then the content (or search configuration) was amended to match the keywords. The content of both reports is also affected by the selected reporting time period. This can also happen if the query is really popular but doesn’t actually return any results, or if a multi-word query is popular but only partially matches within the search index as the top keywords report. |
Searches hourly distribution
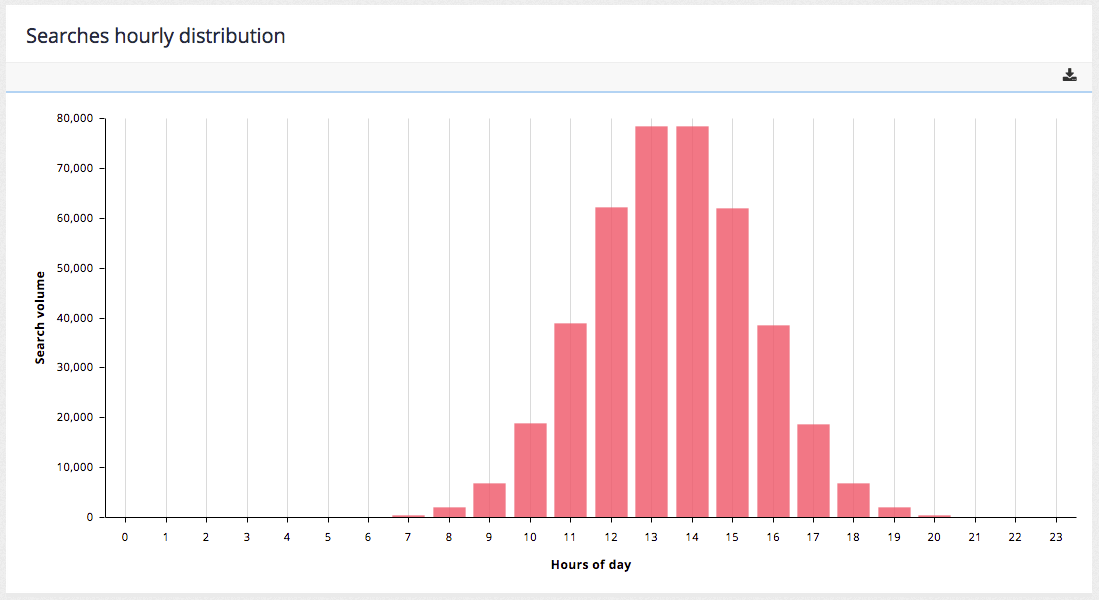
The searches hourly distribution chart shows the total number of searches conducted during the time period broken down by hour of the day. This report provides an indication of when the search load is the greatest and can assist in both capacity and maintenance planning.
Search keyword details screen
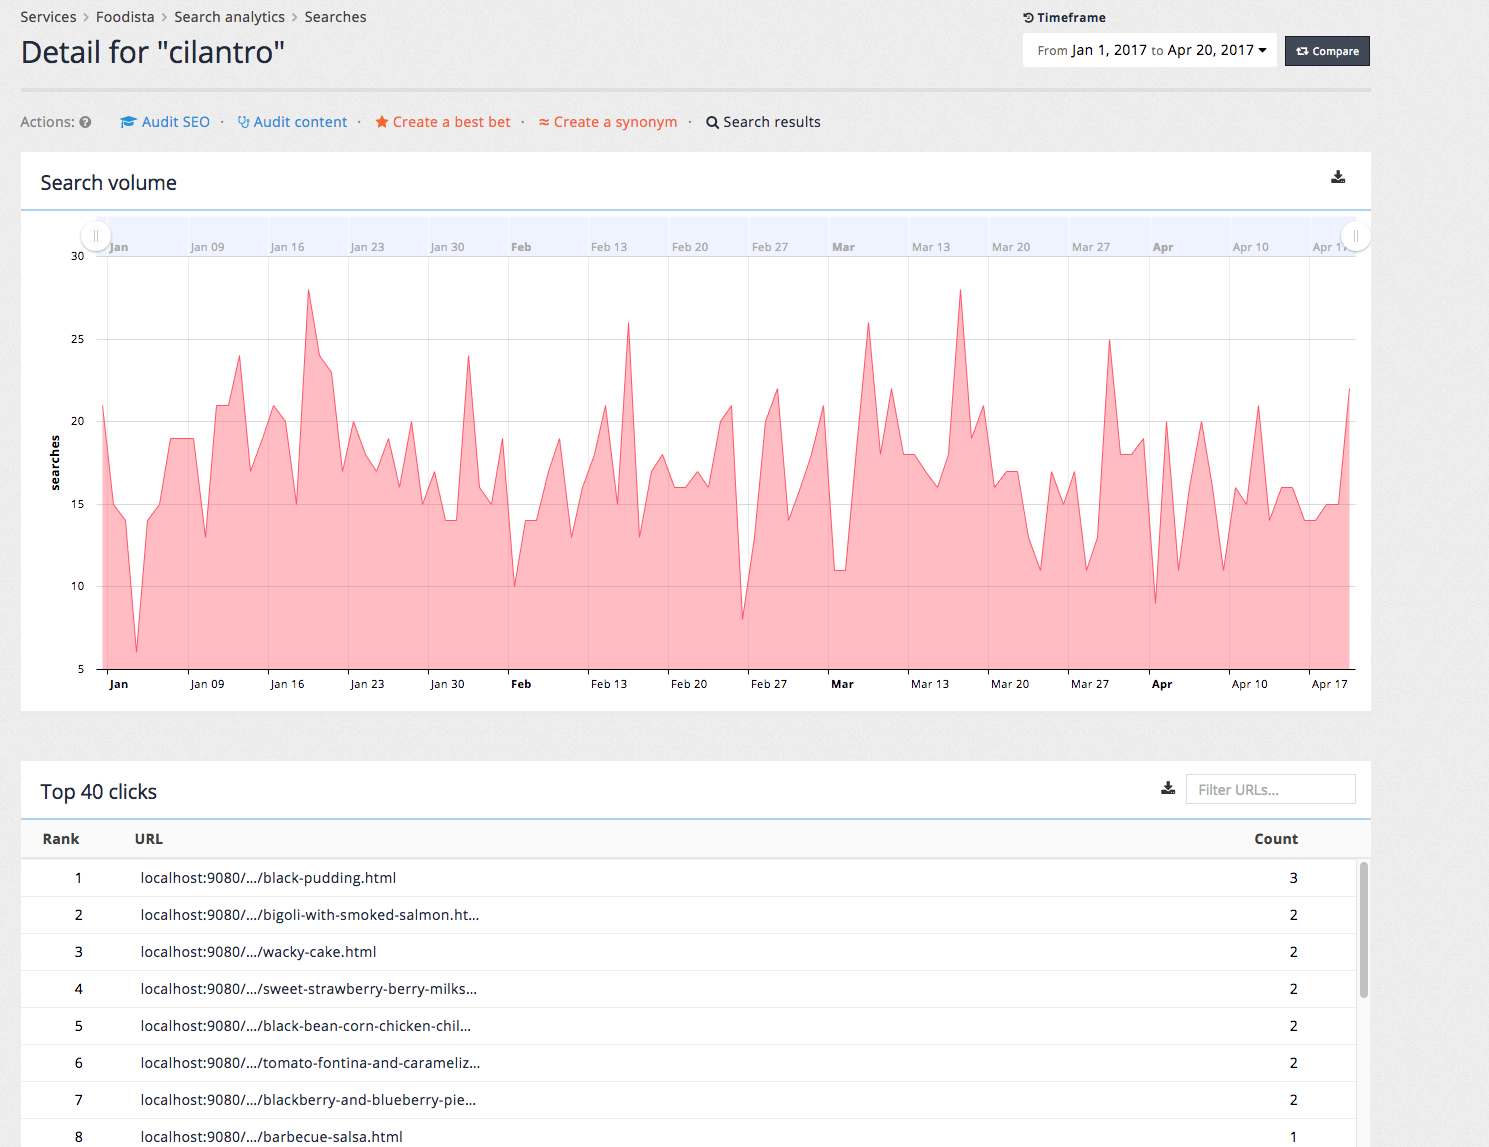
Clicking on a keyword from the top keywords or top unanswered keywords tables opens the details screen for the search keyword.
The search keyword details screen provides the daily search volume for the search keywords and a table of the top result clicks for the keyword.
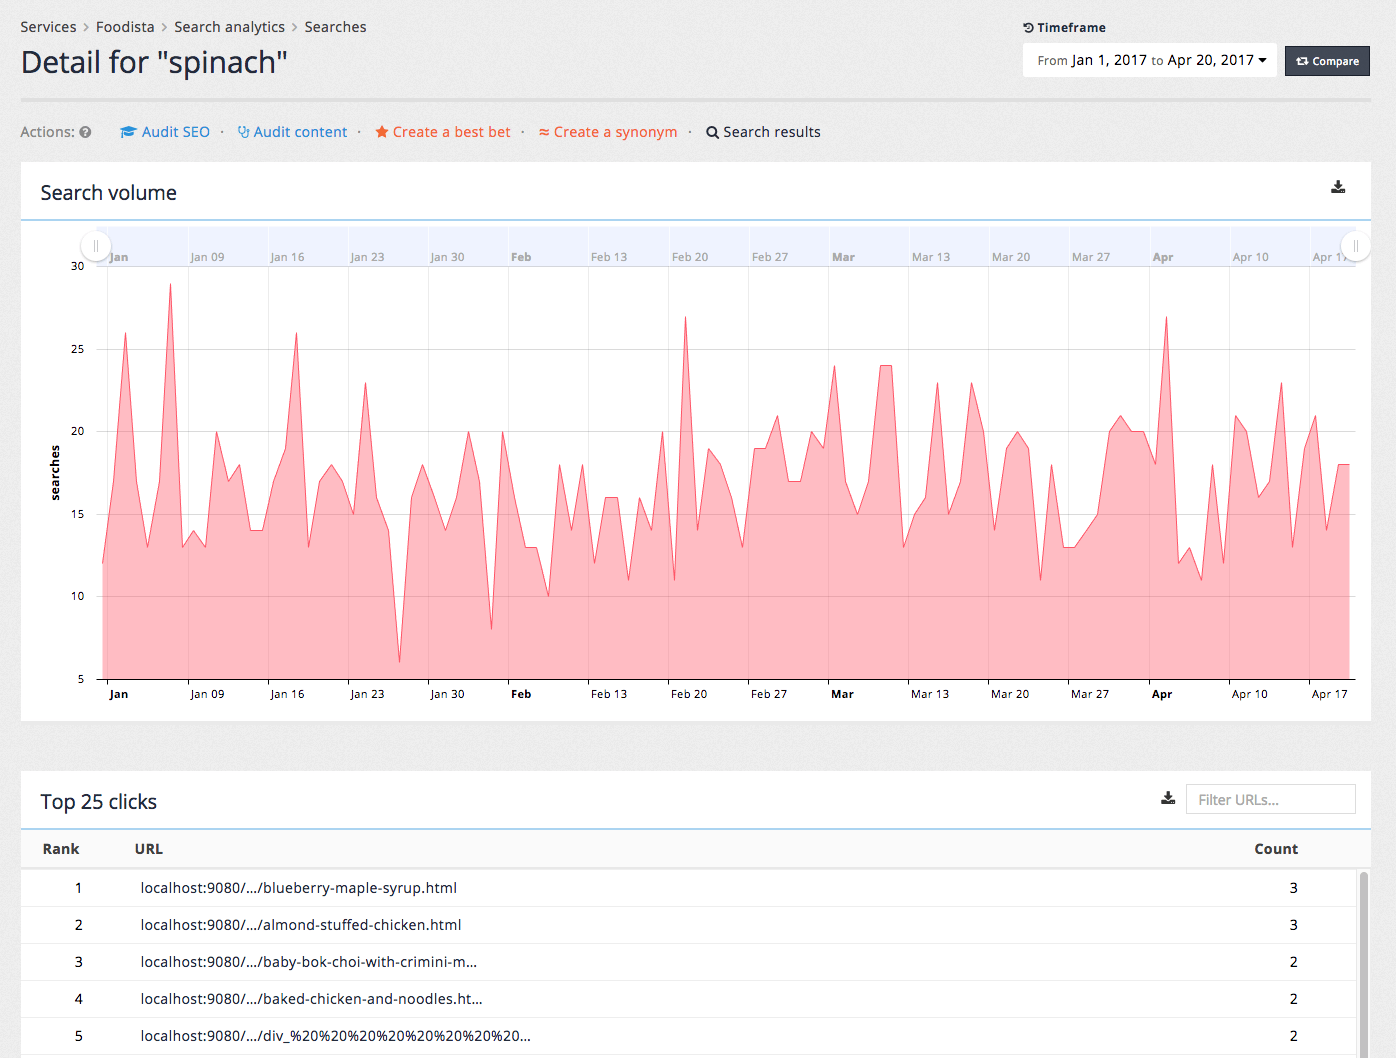
A toolbar providing a set of actions that can be run using the keyword is also applied.

-
Audit SEO: opens the SEO auditor with the keyword pre-entered.
-
Audit content: opens the content auditor report searching for the keyword.
-
Create a best bet: enables quick creation of a best bet using the keyword as the trigger.
-
Create a synonym: enabled quick creation of a synonym using the keyword as the trigger.
-
Search results: returns the current set of search results for the keyword.
Tutorial: Searches report
| The analytics data is auto-generated for the training session and will differ from what is shown in the screenshots. |
-
Select the searches item from the sidebar of the analytics dashboard, or click on the searches count from the summary bar that appears at the top of the analytics dashboard above the monthly summary table.

-
The searches report is displayed. Change the time period to this year. Observe the searches summary which provides a day by day graph of search volume.
-
Zoom in on the searches summary by adjusting the slider controls above the graph.
-
Click the show all button at the top right hand corner of the graph to zoom back out.
-
Filter the top keywords by entering a keyword into the filter searches input box.
-
Export the graphs and tables by clicking on the download button associated with the relevant item.

-
Tables can be exported as CSV and charts as a variety of formats. The chart export function also provides the ability to annotate the graphs before exporting.
-
Investigate a specific search further by clicking on a keyword from the list of top keywords. A search detail screen loads providing an over time graph of search volume for the selected keyword and a table containing the top clicks from searches this term.
Clicks report
The clicks report provides insight into what users are viewing or clicking on as a result of using the search feature of your site.
A click is registered when a user clicks on a search result, noting not only the URL of the result item clicked on but the position of the item in the result set and the search query that was used to obtain the results.
The click information is also used by Funnelback to influence the ranking of search results. For example if lots of users run a search for the term avocado and consistently click on the second result on the results page then this result will eventually get pushed up in the rankings.
Clicks summary
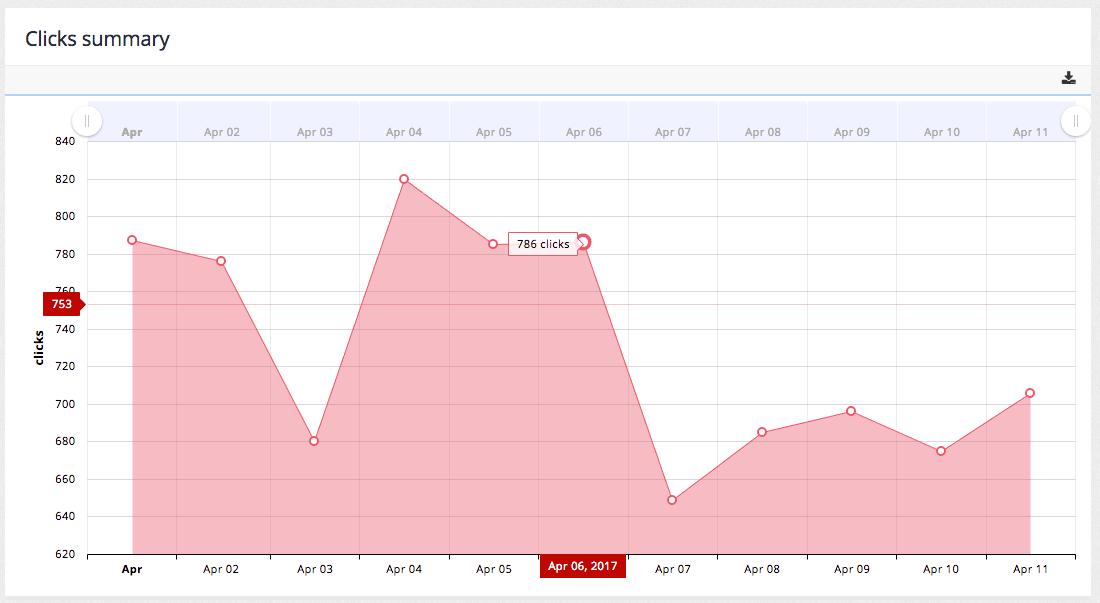
The clicks summary graph plots the number of clicks per day over the selected time period. The chart includes the same zoom and export controls as the searches summary.
Top clicks
The top clicks table lists the URLs of pages that were most frequently clicked on ordered by the number of clicks.
Top best bets clicks
The top best bets lists the best bets that were most frequently clicked on ordered by the number of clicks.
Top faceted navigation clicks
The top faceted navigation table lists the most frequently applied filters. This can provide an insight into how users narrow their searches.
Top contextual navigation clicks
The top contextual navigation clicks table lists clicks on related search categories.
Tutorial: Clicks report
| The analytics data is auto-generated for the training session and will differ from what is shown in the screenshots. |
-
Select the clicks item from the sidebar of the analytics dashboard, or click on the clicks count from the summary bar that appears at the top of the analytics dashboard above the monthly summary table.
-
The clicks report is displayed. The displayed data maintains the date range that was previously set. The clicks report is broken up into five sections. A click is registered when a user clicks on a search results (if click logging is enabled).
Locations report
The locations report provides information on the location and demographics of users of the search.
World map
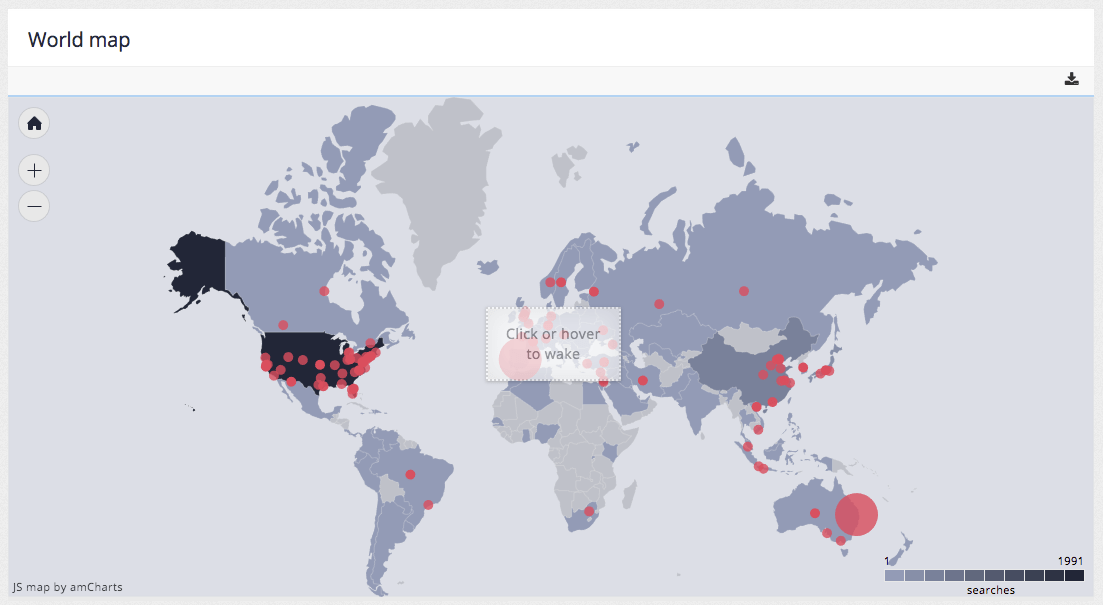
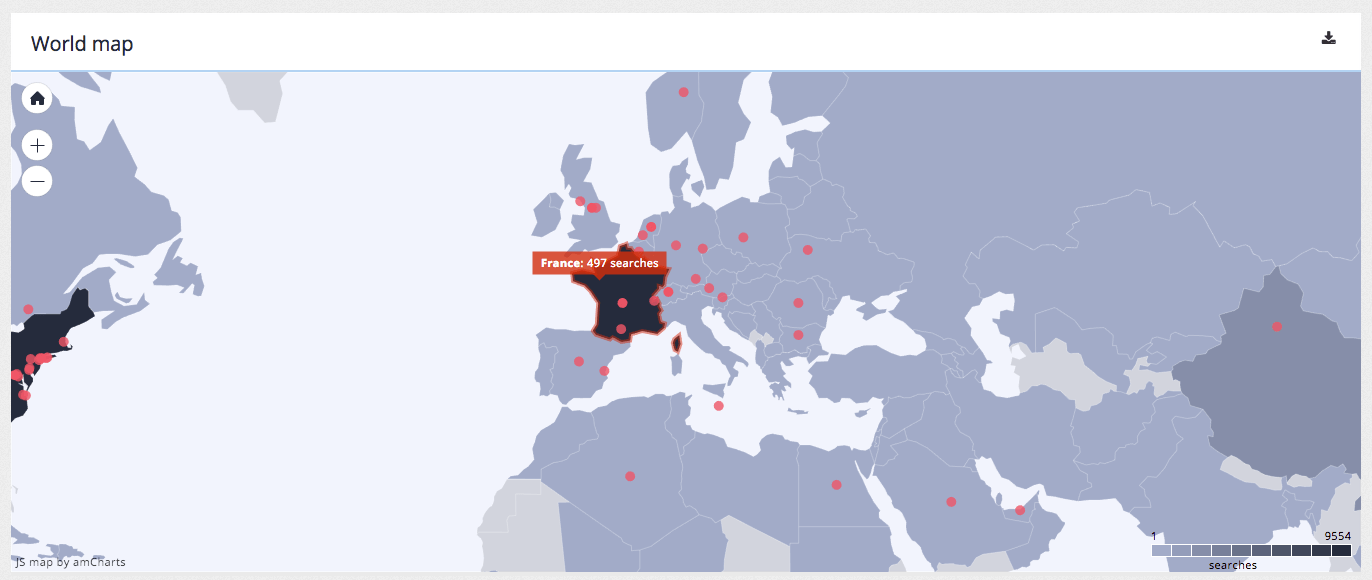
The world map chart plots the location of users of searches onto a map where a location can be determined. The interactive map allows zooming and presents additional information when hovering over countries or points of interest.
A user’s location is inferred from their IP address.
Similar controls for zooming and also for export, annotation and printing of the data are provided.
Top countries
The top countries table lists the top countries based on the origin of search requests. An unknown value indicates that a country could not be inferred from the IP address.
Top cities/suburbs
The top cities and suburbs table lists the top cities / suburbs based on the origin of search requests. An unknown value indicates that a city or suburb could not be inferred from the IP address.
Top IP addresses
The top IP addresses table lists the IP addresses recorded as the origin of searches ordered by the number of searches.
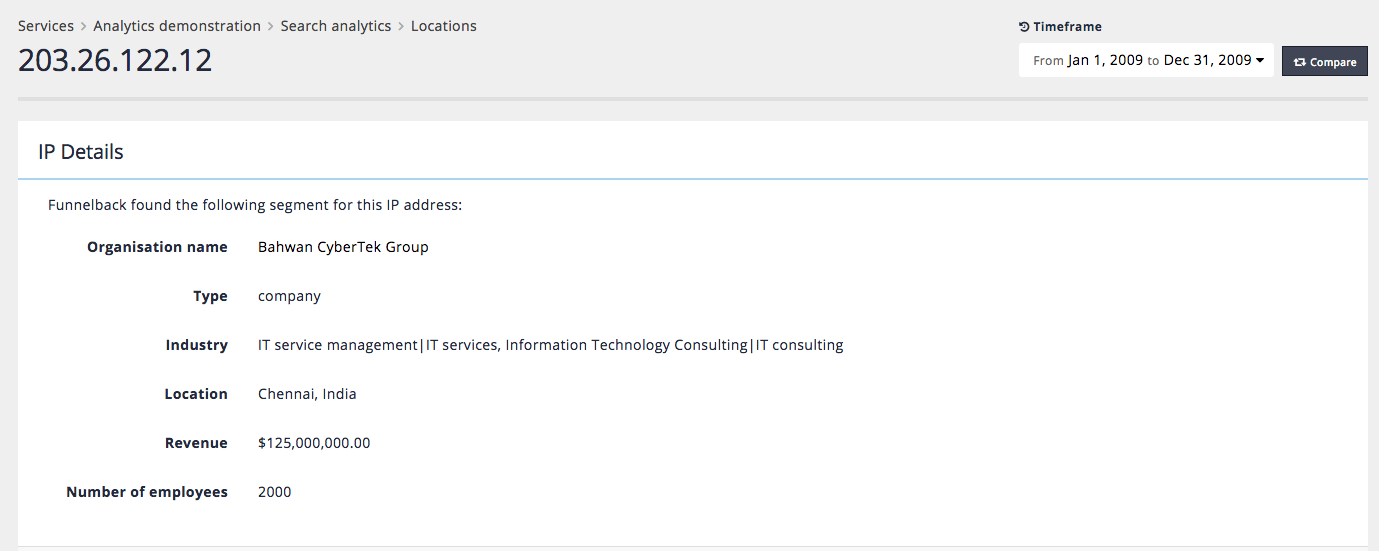
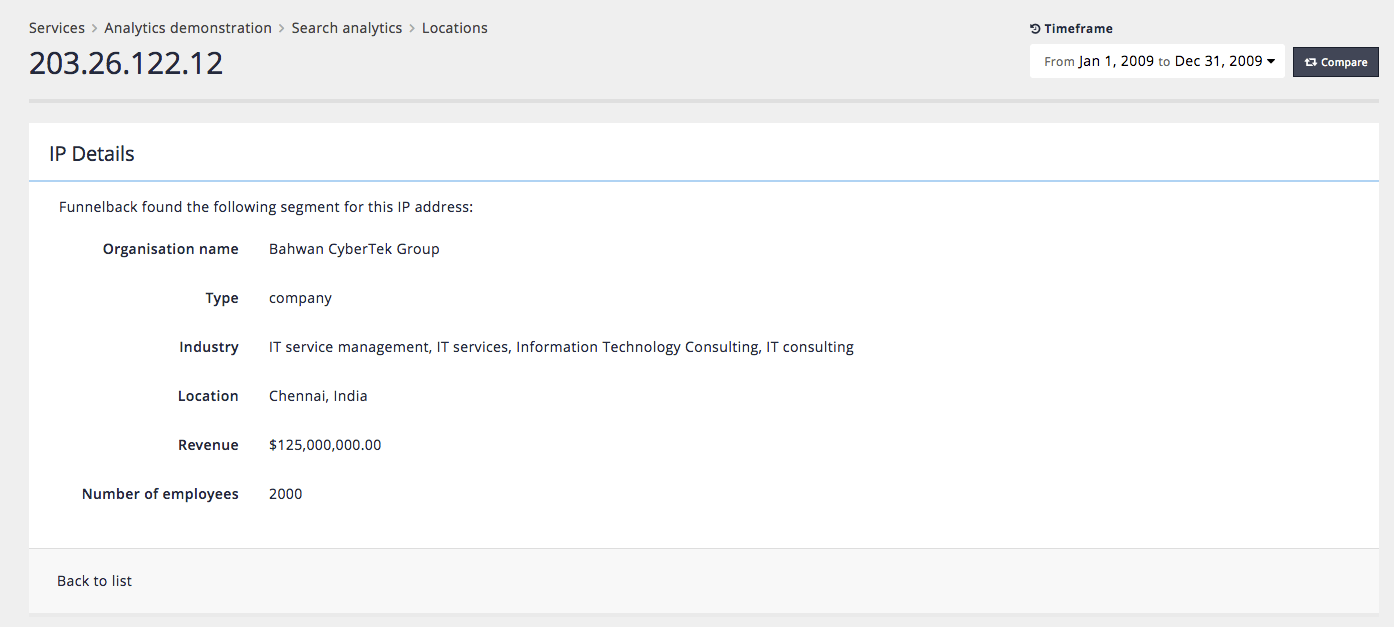
Clicking on an IP address in the table will display the demographic information that is inferred by looking up the IP address in a public database of information recorded about the IP address. The level of information displayed will depend on the available data about the IP address.
For example, inspecting 206.26.122.12 shows the following information:
-
Organisation name
-
Type of organisation
-
Industry
-
Location
-
Revenue
-
Number of employees
Tutorial: Locations report
| The analytics data is auto-generated for the training session and will differ from what is shown in the screenshots. |
-
Select the locations item from the sidebar of the analytics dashboard, or click on the top country from the summary bar that appears at the top of the analytics dashboard above the monthly summary table.
-
The locations report is displayed. The displayed data maintains the date range that was previously set. Investigate the map by using the zoom controls and hovering over countries and points of interest.
-
Observe the top countries, cities/suburbs and IP addresses reports. Investigate further demographic information about an IP address by clicking on an address in the top IP addresses table. Select a few IP addresses that have a known location to get any available demographic information for the address. The available information will vary depending on the address chosen.
Trends report
The trends report provides information on the search trends by listing search keywords that have seen a significant increase in query volume in a short space of time.
These increases, or query spikes, can alert an administrator to topics that have suddenly become popular among users. This could indicate reaction to a news story that has broken, or a report that was recently released.
These trend alerts can be used to enable an organisation to react with greater speed to the changing needs of users.
When a trend alert is raised an administrator can check the query and verify that the results returned are appropriate, or take steps (such as adding best bets or synonyms) to ensure that users are directed to appropriate information.
Trends overview
The trends overview screen summarises spikes in specific search keywords that were detected in the selected timeframe.

The overview provides the following information:
-
Query: the search keyword that has seen a significant increase in volume. Smaller related search keywords are displayed below the main keyword.
-
Shape: a line graph of the query volume for the keyword over time.
-
Confidence: The system confidence that this is a query spike.
-
Peak: When the peak occurred for the keyword.
-
Increase: The percent increase that was detected in search volume for the keyword.
-
User locations: The locations from which the searches for the keyword originated.
Trends detail
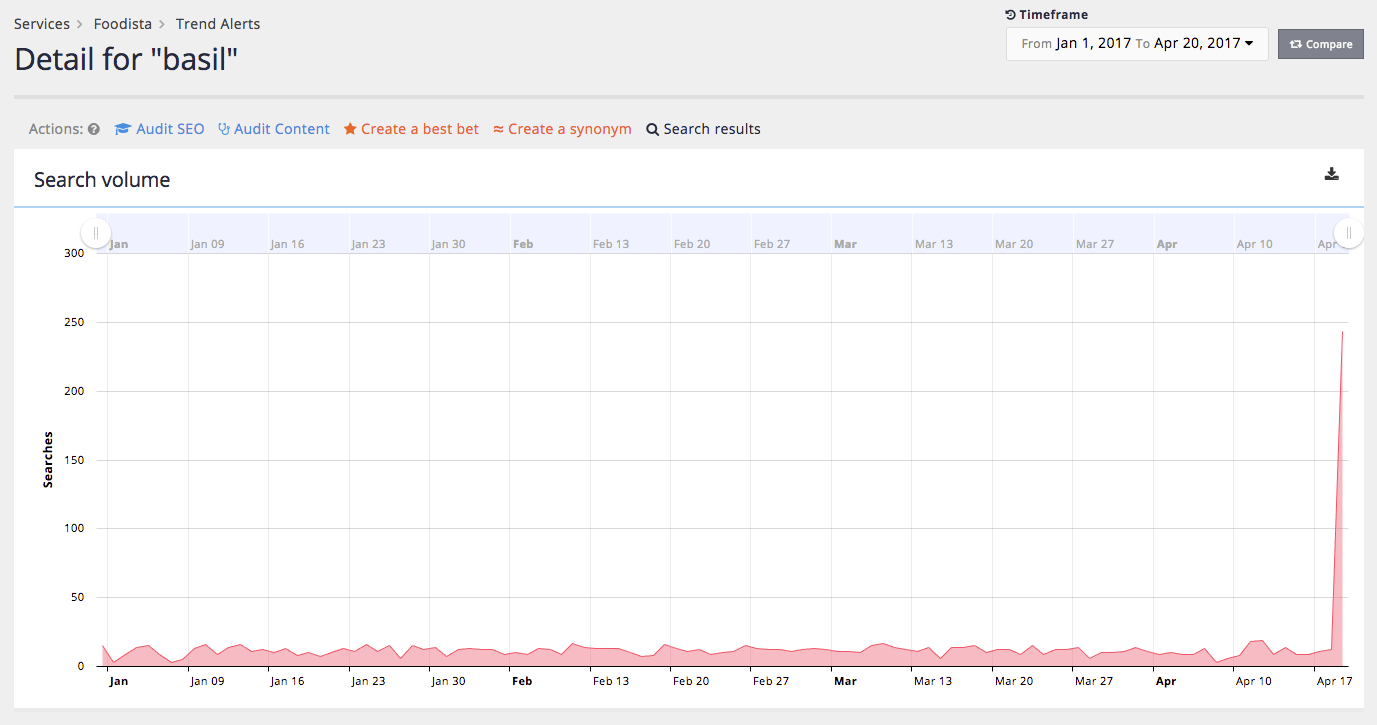
Clicking on a query or graph on the overview screen opens up a detailed screen showing the daily query volume for the selected keyword.
Tools for inspecting the keyword in SEO and content auditor as well as running a search and creating best bets and synonyms are also available from this screen.
Tutorial: Trends report
| The analytics data is auto-generated for the training session and will differ from what is shown in the screenshots. |
-
Select the trends item from the sidebar of the analytics dashboard to open the trends report.
-
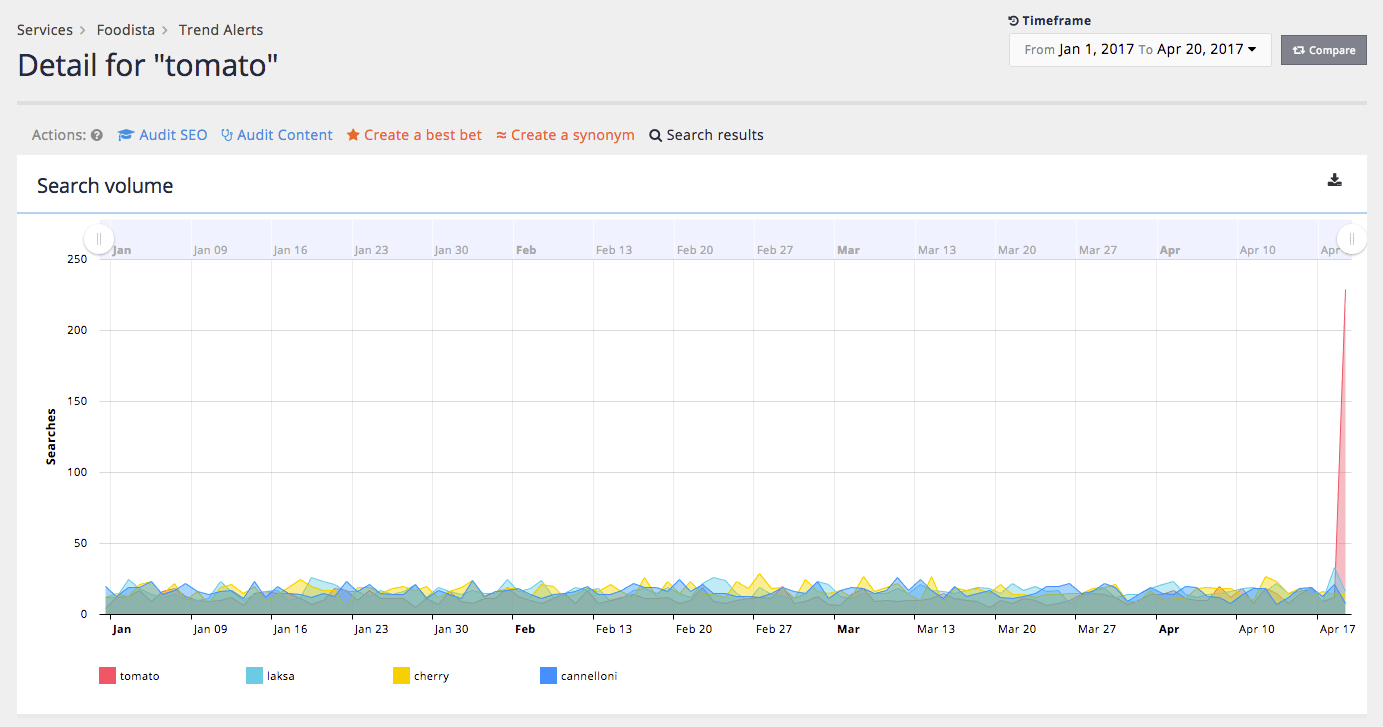
The trends report overview opens showing query spikes detected during the current time period. Observe that some results include related query terms below the query. (for example, see the tomato query in the example below). Note: the related queries in the analytics training example are based on randomly generated analytics so the relationships detected don’t have any true relationship and will appear random.

-
Investigate one of the queries by clicking on the query term or chart. The details screen is displayed showing the day by day number of searches for the search term and any related terms.
Content reports
The content auditor report is designed to assist you to understand and manage your content.
While the tool primarily focuses on your content’s metadata, it can also report on:
-
Readability of your content
-
Usage of undesirable words
-
When content was last updated, modified, published
-
Response times of your content
-
Discovery of duplicate content
The content auditor report can be filtered in a number of various ways through the recommendations, overview, attributes and search results screens.
Accessing the content auditor report
You can access the content auditor report by selecting the content auditor tile from the insights dashboard, or by clicking the content auditor link from the results page detail page in the search dashboard.
Tutorial: Accessing content auditor reports
-
From the insights dashboard select the foodista results page then click on the content auditor tile, or select content auditor from the sidebar menu.
-
The content auditor - recommendations screen will then load.
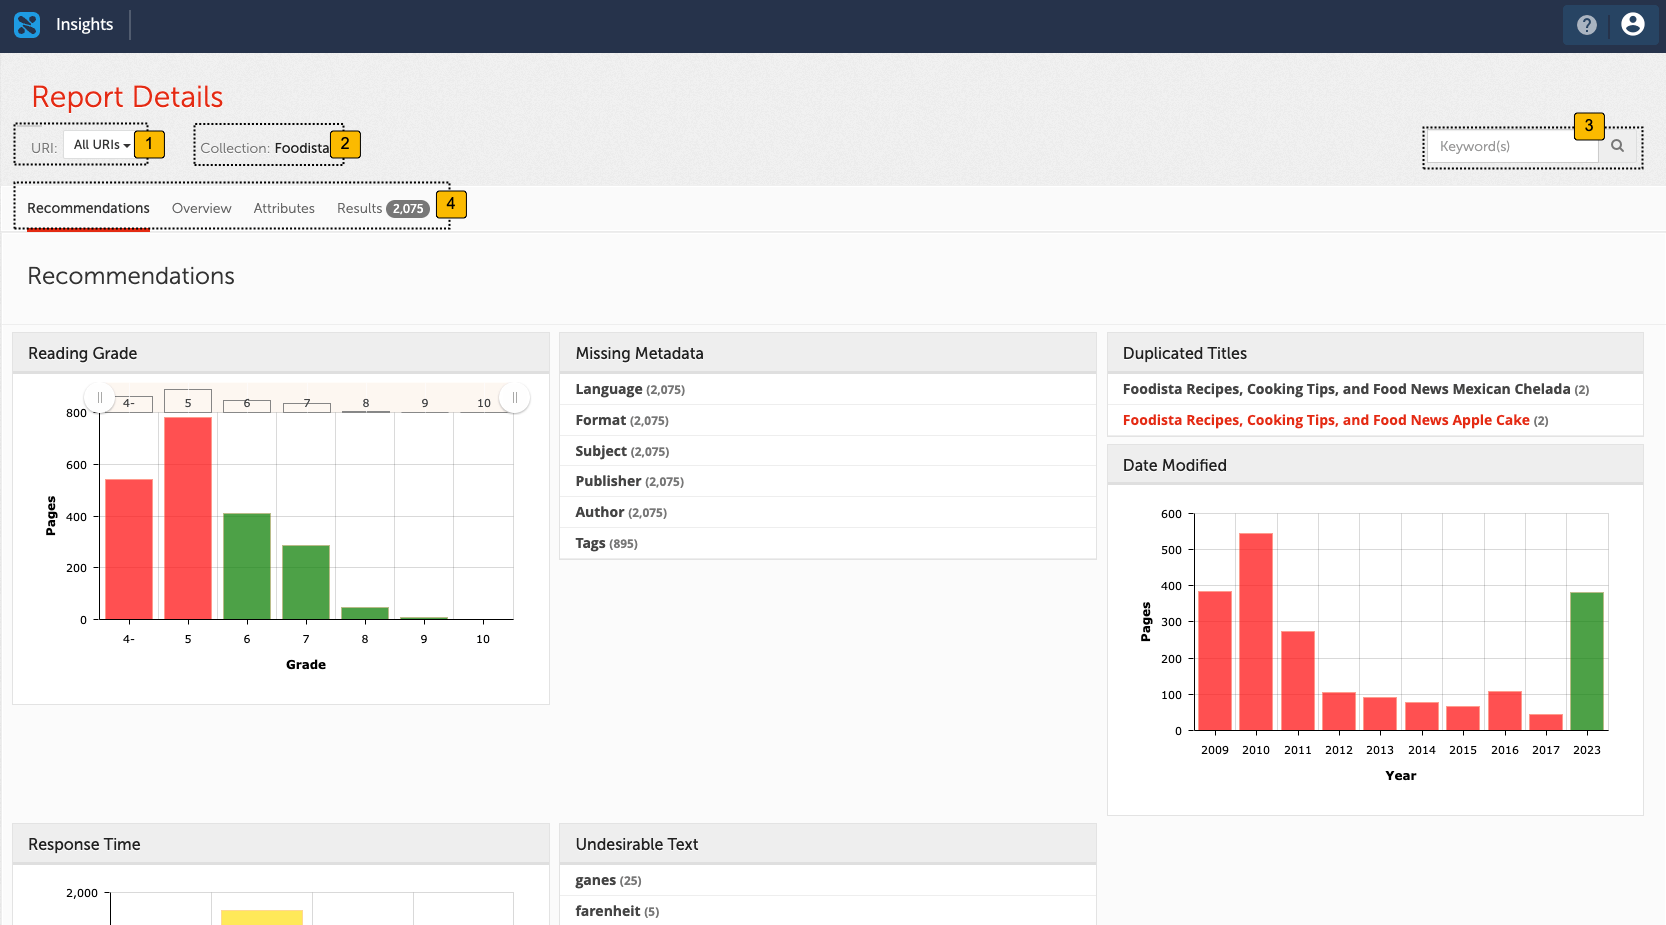
-
Filter report by folder
-
Indicates the results page that this is reporting on
-
Filter report by keyword
-
Report sub-sections
Recommendations
The recommendation screen within the content auditor provides you with a number of different reports about the overall quality of your content.
Reading grade report
The reading grade chart reports on the reading grade level of pages in the index. The reading grade is assessed using the Flesch-Kincaid readability scale. This estimates the reading level required to understand the content from the user’s point of view. The grade level is the level of schooling - a grade of 8 corresponds to an 8th grade reading level, or that easily understood by a 13-14 year old in 8th grade.
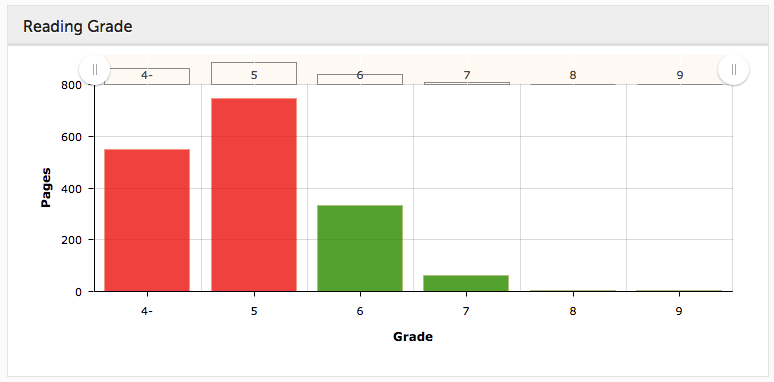
A reading grade level of 8-9 is considered plain English. For WCAG 2.0 accessibility compliance (Level AAA) the readability of your sites content should be secondary school level (grade 9) or lower. The pages audited for the chart above pass this AAA check.
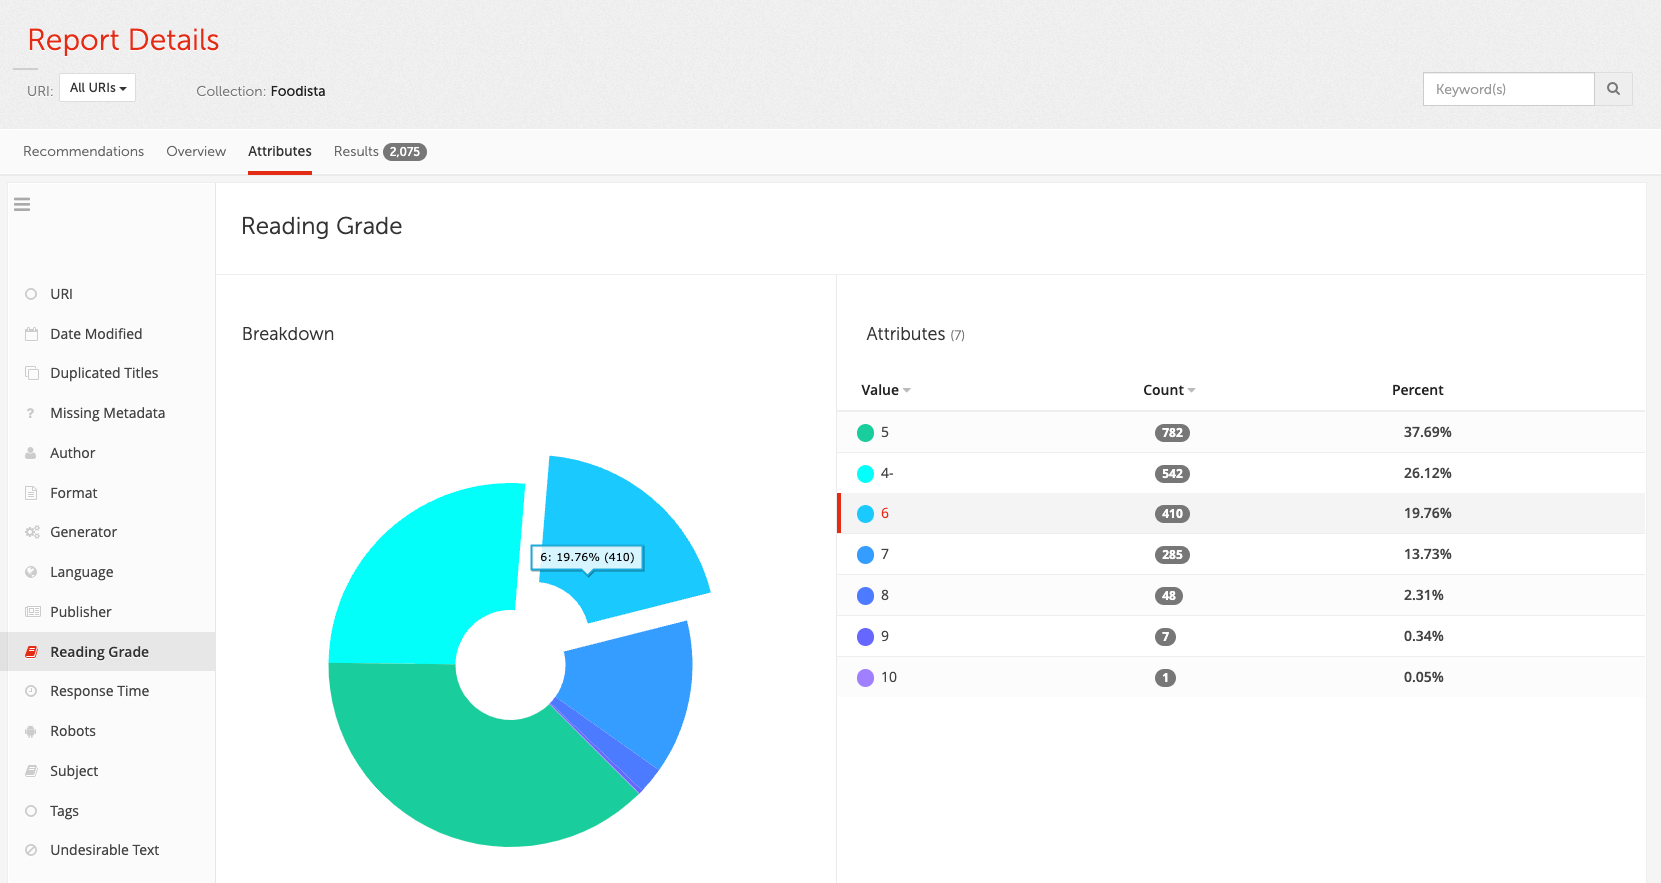
Clicking on any of the bars in this report filters the recommendations data based upon that reading grade level. For example by clicking on the grade 5 level we get an analysis of that specific grade.
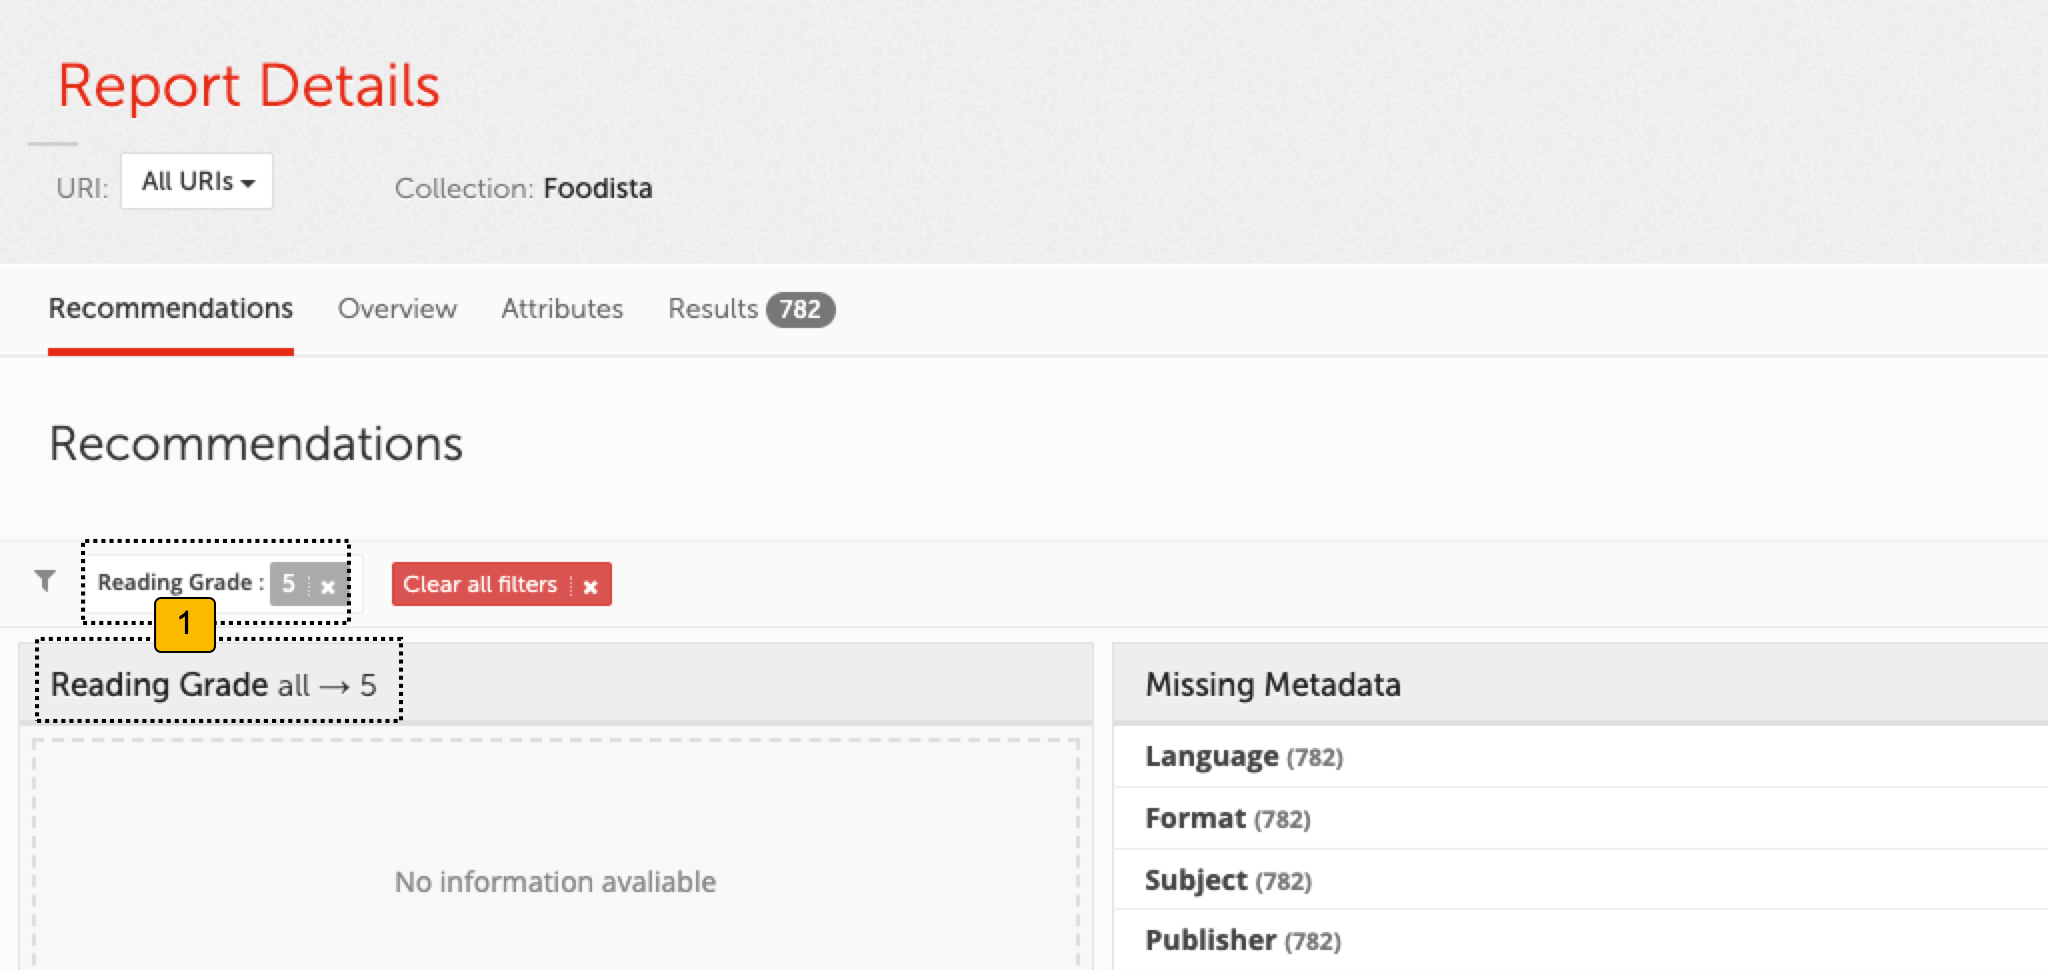
-
Indicates that a filter (reading grade = 5) has been applied to the report.
Missing metadata report
The missing metadata table identifies pages that are missing metadata fields that are configured for reporting within the content auditor.
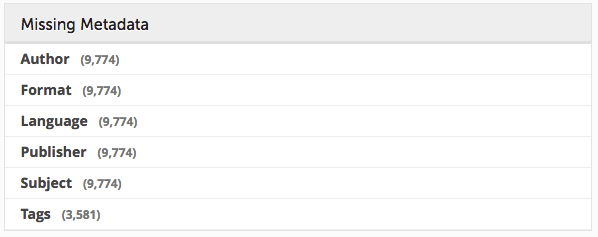
By default the content auditor reports on author, format, language, publisher and subject metadata.
Clicking one of the items filters the report to report on only items missing the selected field.
For the search in the example above the default tags are missing in all pages. An additional metadata field, tags, is also reported on and this is missing from 3581 pages on the site.
Duplicate titles report
The duplicate titles table lists titles that are found in more than one page. A duplicate title could indicate a duplicate content page, or a poorly titled page.
Duplicate titles should be avoided as these can cause confusion with users.
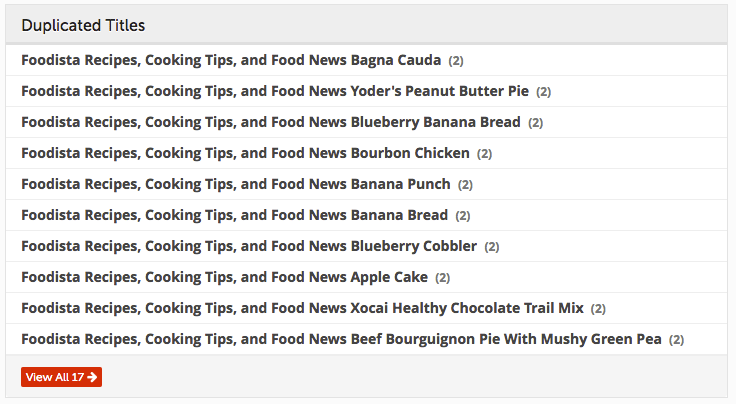
This table can be used to identify the pages with duplicate titles so that a web administrator can take the appropriate action (which could be removing duplicate content or re-titling a page to provide better context.
Clicking one of the items filters the report to report on only items that contain the selected title. Clicking the view all button opens up the attributes report.
Date modified report
The date modified report presents a chart of when pages / documents were last modified. This is based upon the metadata of the page/document and can be helpful to identify which documents should be updated and/or reviewed.
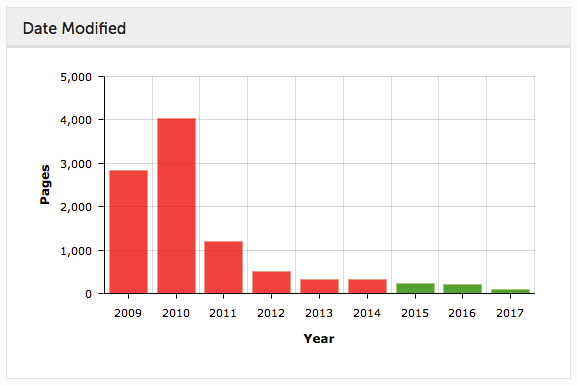
Moving your mouse across each of the bars in the chart, will give you a glimpse of how many pages / documents have changed in a certain timeframe. Clicking on a bar filters the report to the selected year.
Response time report
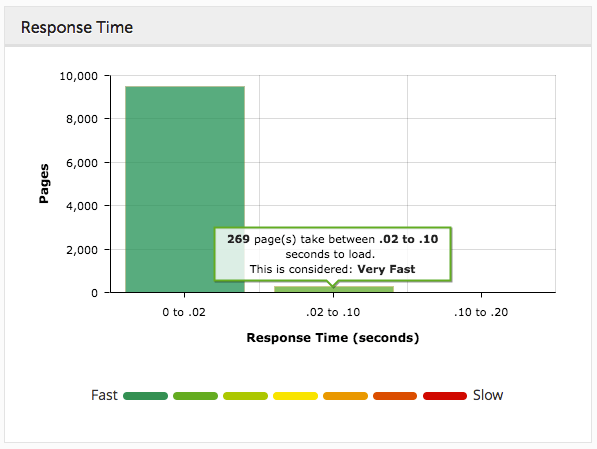
The response time report provides you with a bar chart of the time taken to download documents. This may help identify pages / documents / sections or entire sites where response time is in need of improvement.
Note: the response time only tracks the time taken to retrieve the document and doesn’t include linked resources. It is not the same as a page load time which includes the time taken to load these resources (such as images presented in a HTML page).
Hovering over the bars in the chart provides additional information.
Undesirable text report
The undesirable text table reports on undesirable words found within the content.
By default, the undesirable word list includes common misspellings but can be customised to identify organisational-specific undesirable words (such as specific words banned in editorial policies or other terms such as acronyms).
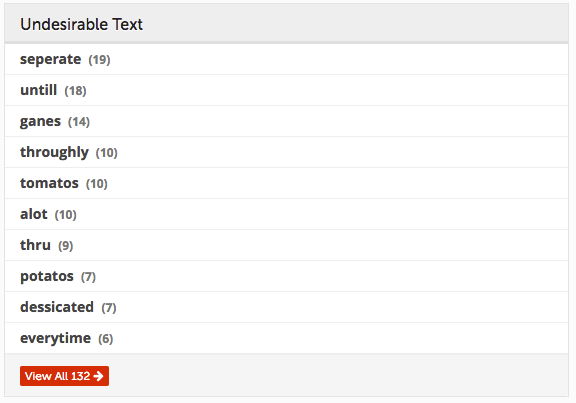
Clicking one of the items filters the report to report on only items that contain the specific word. Clicking the view all button opens up the attributes report.
Duplicate content
The duplicate content report shows documents for which the content (or if configured, some metadata) is duplicated by other documents. Duplicated content makes site more difficult to navigate, and may also be penalized as a ranking factor by some search engines.
Tutorial: Content auditor recommendations
-
Log in to the insights dashboard and select the Foodista results page. Access the content auditor report by clicking on the content auditor sidebar item, or by clicking on the content auditor tile within the main dashboard display.
-
Observe the different tables and charts that form the recommendations page - reading grade, missing metadata, date modified, duplicated titles and response times.
-
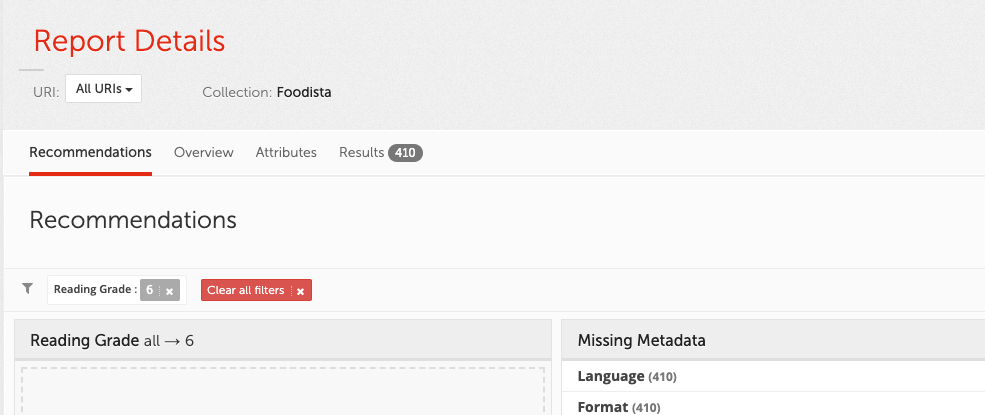
Click on the bar with a value of 6 from the reading grade chart. The display changes to indicate that filters are applied for a reading grade level of 6. The reading grade chart disappears and the other tables and charts update with the filter applied. The filter will remain applied while navigating around the content auditor report until it is removed by clicking on the cross that appears next to the reading grade filter, or by clicking on the clear all filters button.
-
Click on tomatos from the undesirable text table. The display updates to indicate that the undesirable text filter is applied for the word tomatos. Observe that the reading grade filter is still applied. The report now displays information for pages with a reading grade of 6 that includes the undesirable text tomatos.

-
Clear the filters by clicking on the clear all filters button. The content auditor report reverts to the original state.
Content auditor overview
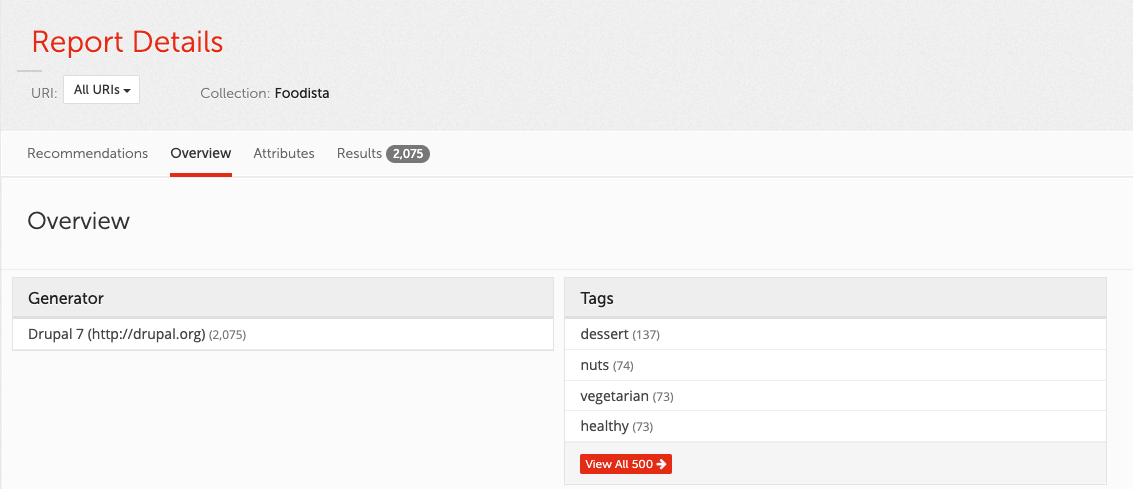
The overview tab reports on the top values found for each of the metadata fields covered by the content auditor report.
Metadata fields that are configured but missing in all the pages are suppressed.
Each metadata field can be explored further by clicking the corresponding view all button, or the report filtered to just the specific metadata value by clicking on one of the values.
Content auditor attributes
The attributes tab provides a complete list of metadata values for each metadata field that is included in the content auditor report. Clicking on one of the values in the list will restrict subsequent reports to documents containing that metadata value.
Content auditor search results
The search results tab lists the individual pages that match the current search criteria which consists of any search terms entered into the search box filtered by any of the metadata values selected on other screens.
The results are returned as a table that shows the metadata values for each item along with some tools linking in with other parts of the insights dashboard.
The table lists:
-
Title and URL of the document / page
-
File size
-
Last updated date
-
Format
-
Metadata that is configured to be reported on
-
Quick access to additional tools
The listing can be exported as CSV.
Additional tools are available for each item in the listing providing quick access to the tool in the context of the selected page:
| Symbol | Name | Function |
|---|---|---|
Analyse anchor tags |
Provides information about pages that link to the current page. |
|
SEO auditor |
Loads the page into SEO auditor, allowing for analysis on how the page performs for specific search terms. |
|
Check accessibility with WCAG auditor |
Information on how the page conforms to WCAG accessibility checks. |
|
Preview the page / document |
Shows a thumbnail sized preview of the page. |
|
View cached copy |
Loads the cached (or locally saved) copy of the page. |
Tutorial: Metadata reporting
-
Log in to the insights dashboard and select the Foodista results page. Access the content auditor report by clicking on the content auditor sidebar item, or by clicking on the content auditor tile within the main dashboard display.
-
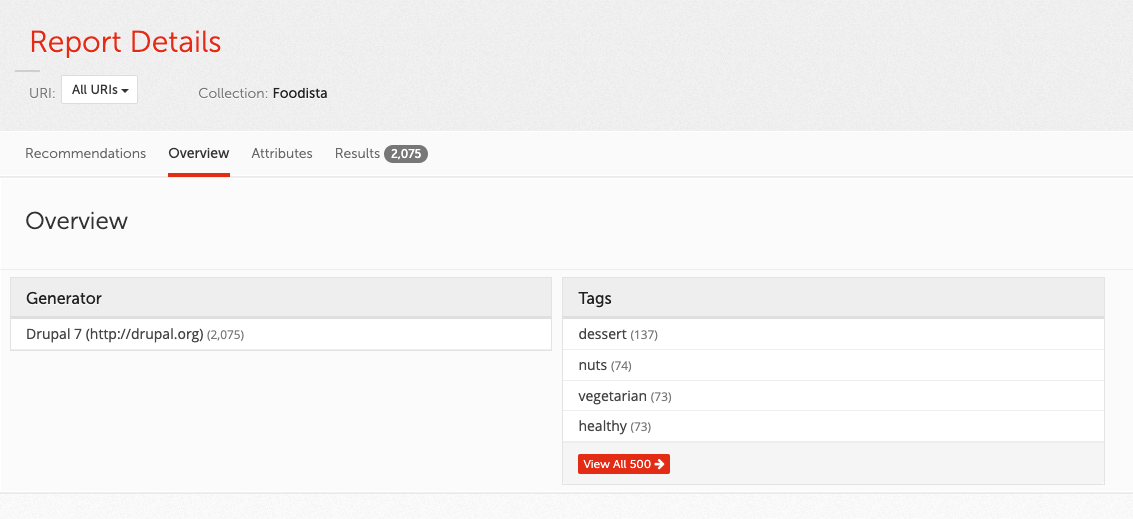
Click on the tab labelled overview. The metadata overview appears showing the top four values for generator and tags. Tags is a custom metadata field that has been configured for the Foodista search. Note: the other default metadata fields (author, subject, language etc.) are not shown because the pages on the Foodista site does not include any of this metadata, and information presented on the recommendations screen is also suppressed.
-
Click on the view all link that appears below the tags table.
-
Subdivide this report further to show only content tagged with nuts but clicking on the nuts entry in the tags listing.
-
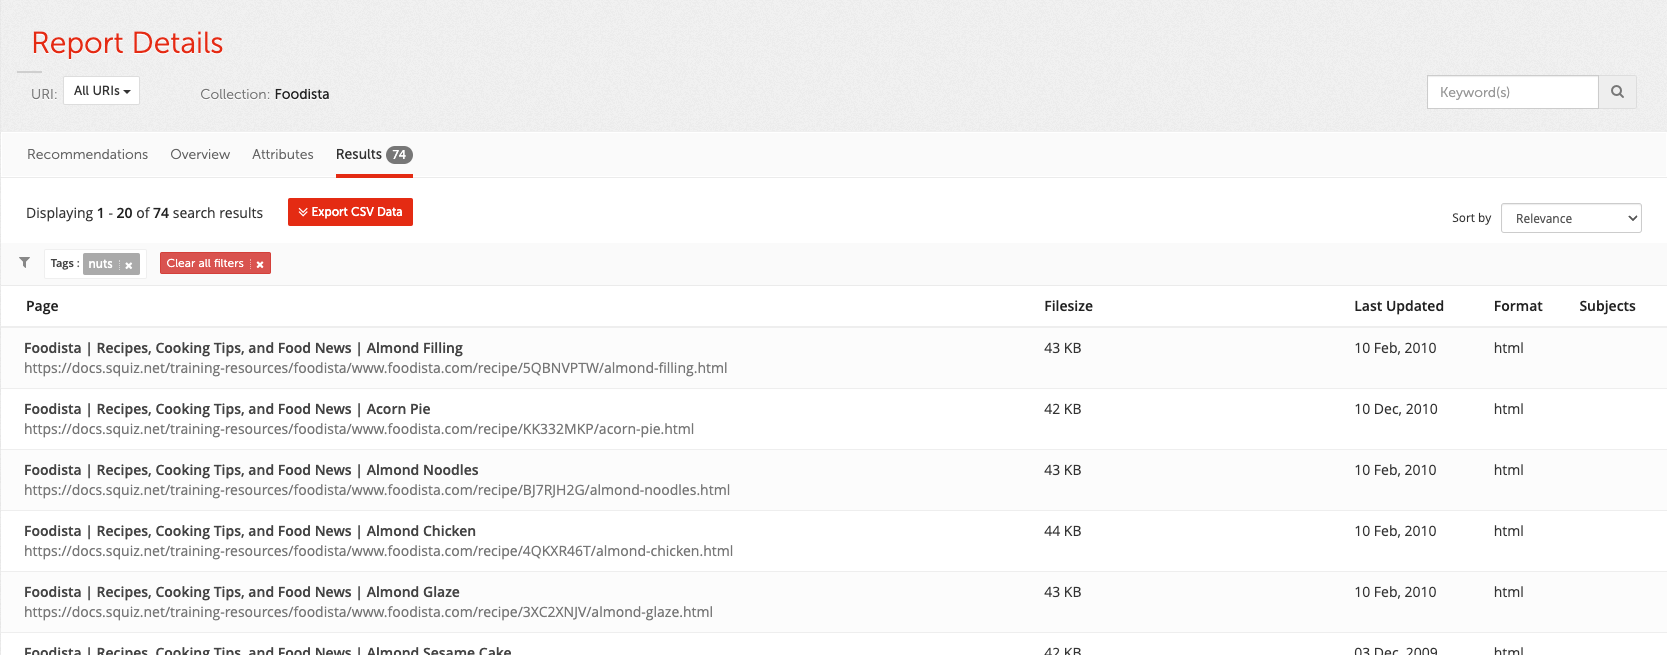
No further detail is available to drill down on in the tags attribute. The individual pages tagged with nuts can be viewed from the results tab:
-
Within the search results tab, we can examine each matching result in more detail. Hovering over each result will trigger the appearance of additional icons:

-
For a given search result, trigger the anchors summary sub-report, showing which pages within a collection link to this one, and what link text is used.


The anchors summary lists information about the links that reference the page that is being examined including the words used (which are counted towards the content for the document) as well as the type of link.
-
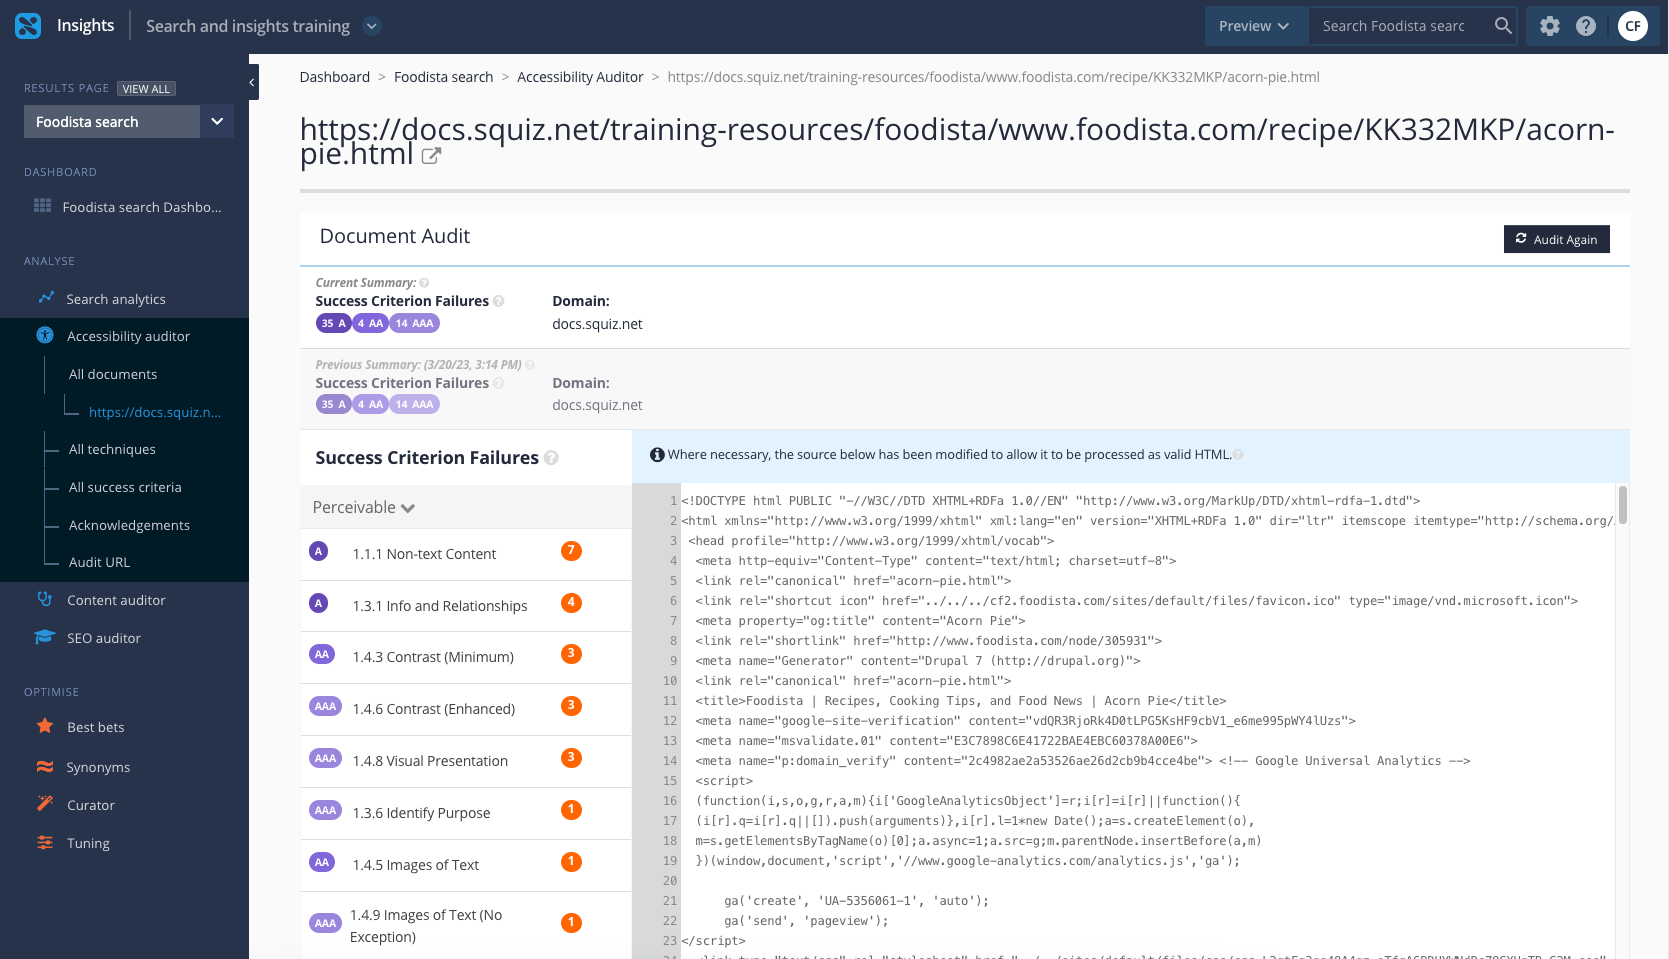
For a given search result, trigger the accessibility auditor sub-report, producing advice on how to improve the page’s compliance with WCAG2:

-
For a given search result, trigger the preview functionality, showing a thumbnail of how the page appears for a desktop-based browser by hovering over the eye icon:

-
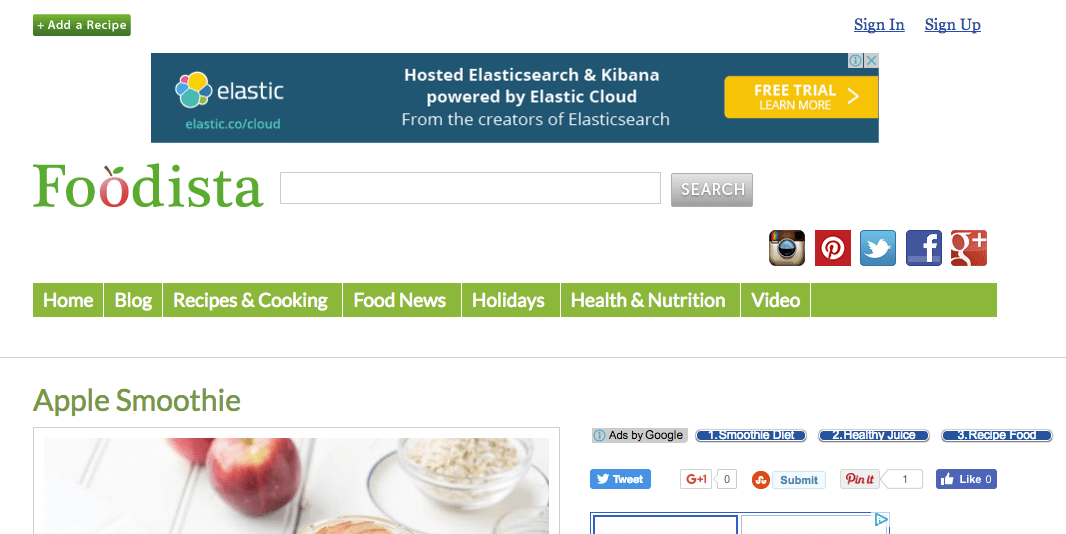
For a given search result inspect the cached copy of the document by clicking on the history icon:

Tutorial: Export content auditor reports
-
Export the report as a CSV file by clicking on the export CSV data button:

-
A download should start automatically with the file saved to your default download location as
content-auditor-export.csv.
Accessibility reports
Accessibility auditor examines web content for accessibility compliance against version 2.1 of the Web Content Accessibility Guidelines.
Using Funnelback’s underlying crawling and filtering technology, millions of URLs are examined for conformance on a regular basis, with conformance able to be examined over time. Once configured, a successful run against a collection will provide a series of reports via a web-based user interface for logged-in users.
The WCAG standard defines twelve guidelines that detail how to make website content accessible. The guidelines are organised into four key principles known as the POUR principles which stand for:
-
Perceivable
-
Operable
-
Understandable
-
Robust
Each principle consists of a number of rules and guidelines for ensuring web content is accessible. These rules and guidelines are then broken down further into levels of compliance, which are general ratings that websites strive to attain.
-
Level A (single A).
-
Level AA (double A).
-
Level AAA (triple A).
Success criteria and techniques
-
Success criteria are the standards of accessibility that need to be met in order to achieve WCAG compliance.
-
Techniques are the recommended ways in which these criteria can be met. There can be different sets of techniques that can be used to meet a single success criterion, meaning that WCAG compliance is possible while still recording technique failures as a technique failure does not necessarily indicate failure to comply with WCAG.
Accessibility auditor analyses the web content from HTML and PDF documents as the pages are gathered and checks the content for WCAG compliance, producing a report on the WCAG compliance and also providing advice on how to correct the detected errors.
Limitations
-
Funnelback accessibility auditor implements a subset of checks from the WCAG 2.1 standard. While the tool assists with gaining WCAG compliance, it can’t certify that a site is compliant because many of the WCAG checks cannot be implemented by a computer and require human intervention.
-
The accessibility audit reports produced by Funnelback only cover HTML and filterable PDF documents.
The Funnelback accessibility auditor tool is a great tool for checking your site for accessibility compliance, but should not be the only method used to check content. The auditor tool only checks the accessibility of machine-readable HTML and PDF content. A large number of checks required for full WCAG compliance require manual checking.
Accessibility auditor summary
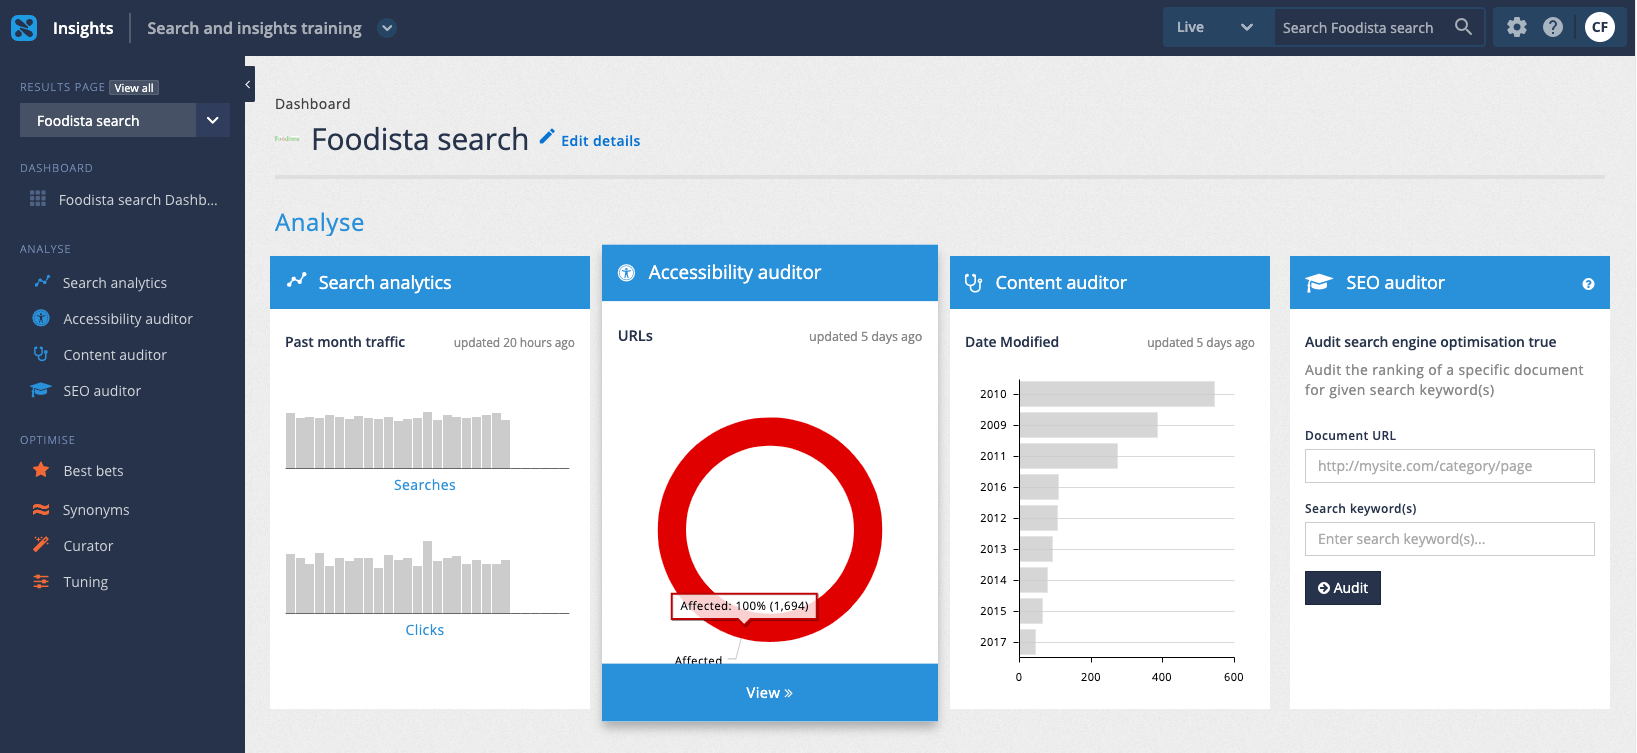
The main services page within the insights dashboard displays a summary of the current accessibility auditor conformance for the service.
Accessibility auditor overview report
The accessibility auditor overview provides a snapshot of the accessibility compliance of pages belonging to the current results page. This provides an at a glance summary of the current performance, and also a way to immediately see the affected pages at each accessibility level.
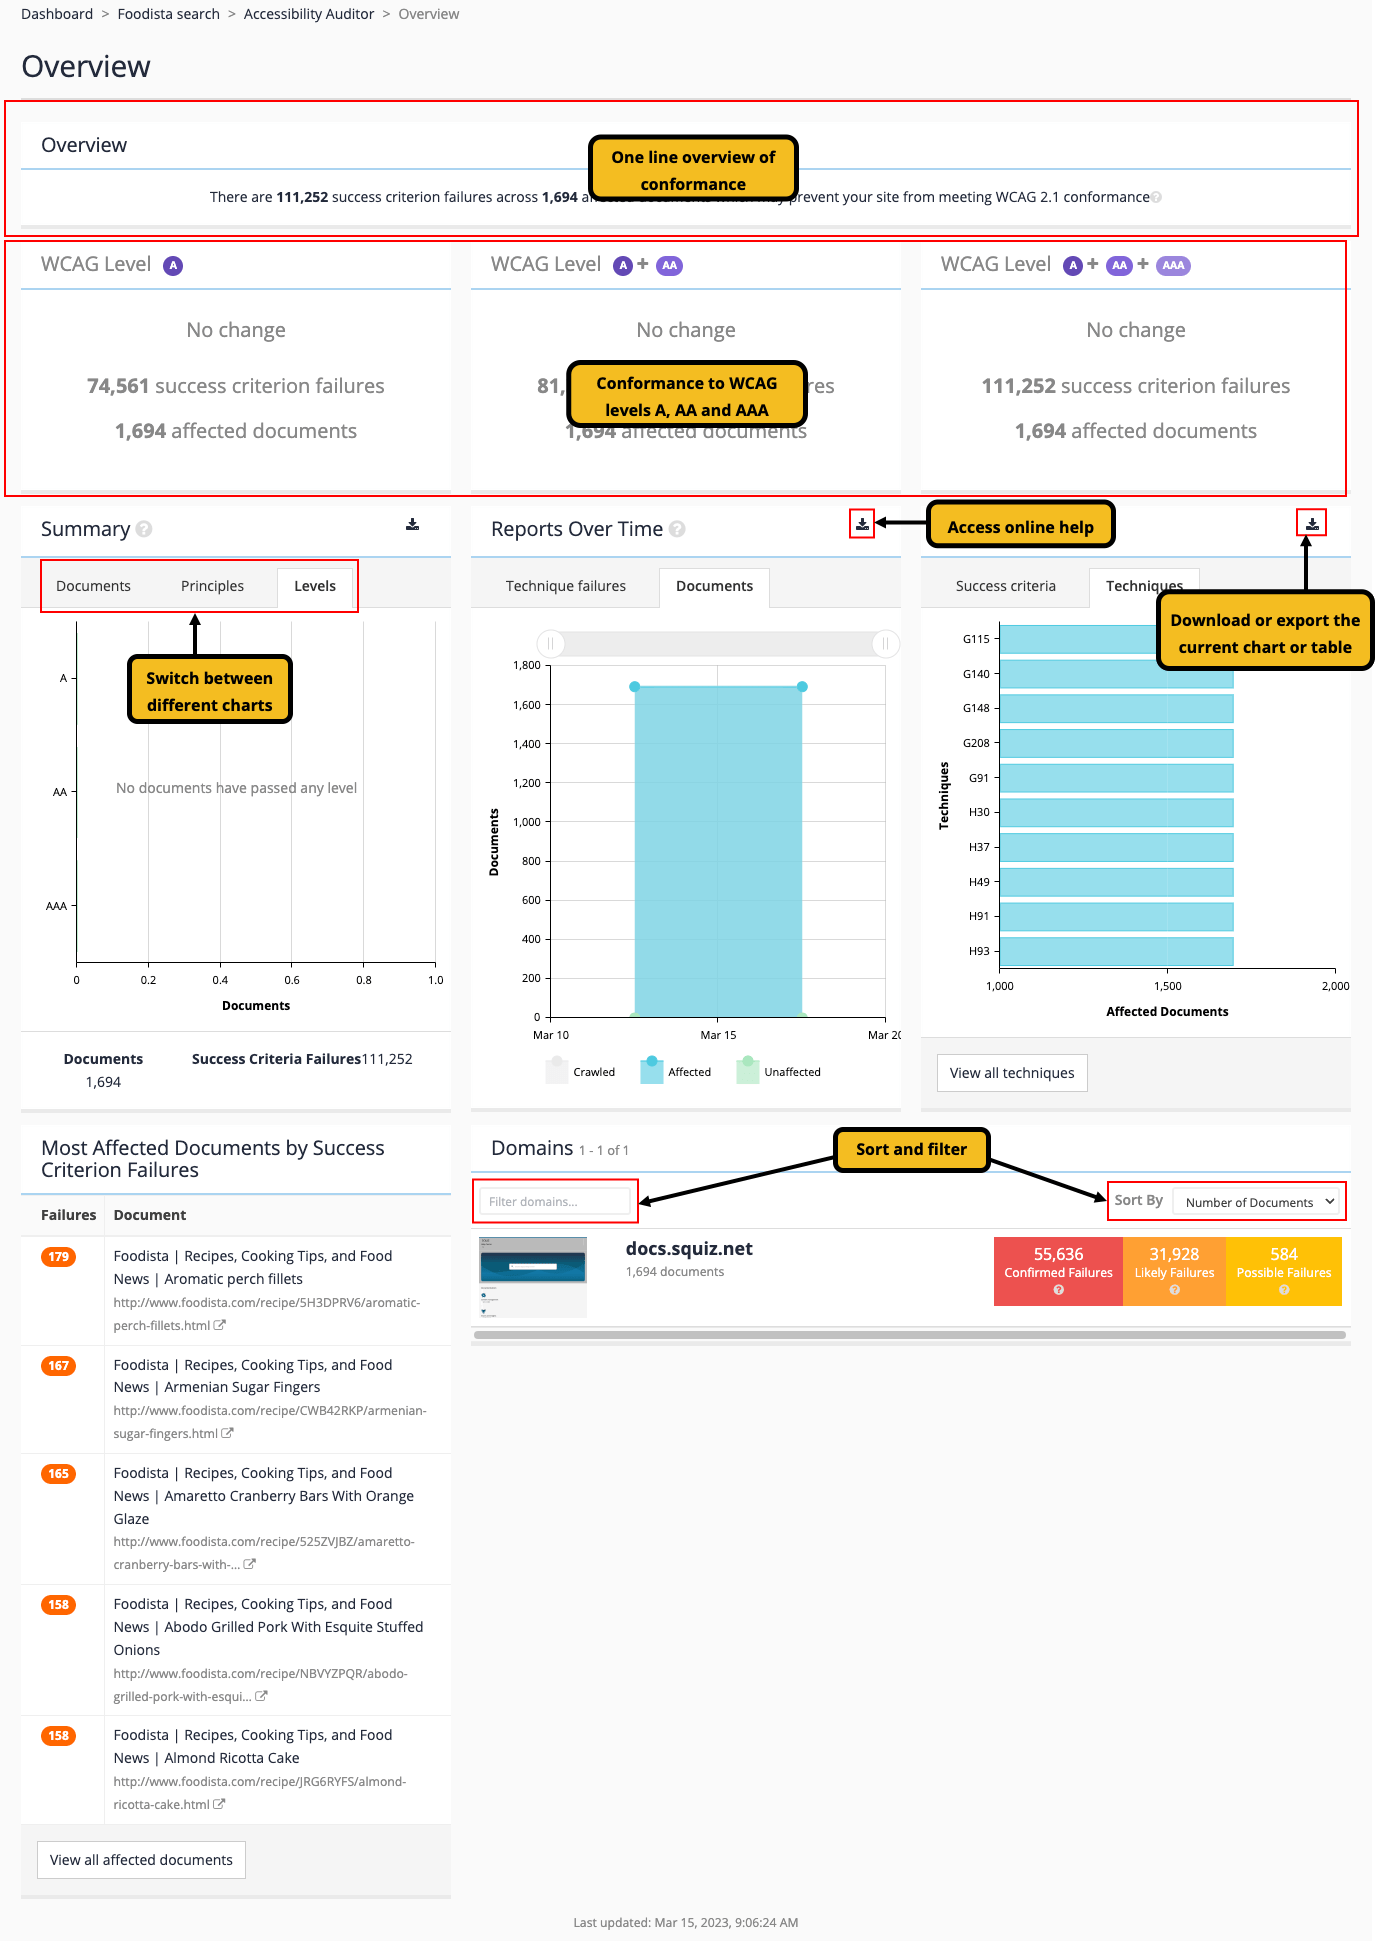
The screen is made up of a number of widgets:
-
Overview: A one-line summary of the accessibility audit for the service.
-
Compliance to WCAG levels A, AA and AAA: Summary of how the service meets the different WCAG compliance levels, with the ability to see the documents that fail to meet the level. Clicking on one of the tiles opens up a document report restricted to that WCAG level.
-
Summary: Provides an overall picture of the current state of the accessibility audit for the service. The widget includes three tabs:
-
Documents: pie chart that segments the service into affected documents (that do not pass all the machine checks), unaffected documents (that pass all the machine checks) and unchecked documents (that were not audited).
A report on unchecked documents can be accessed by clicking on the small exclamation mark that will appear next to the documents count below the chart. -
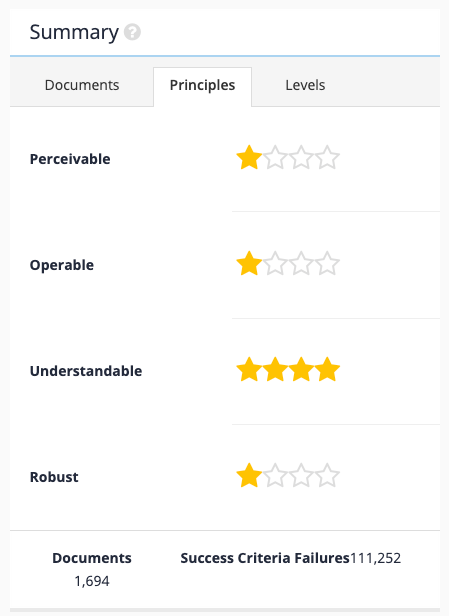
Principles: provides a star rating of how well the service rates against the four principles of the WCAG specification.
-
Levels: provides a summary of the documents that pass the automated WCAG A, AA or AAA checks.
-
-
Reports over time: shows how the service has performed over time. The widget includes two tabs:
-
Issues: shows the number of failures and potential issues that need review detected over time.
-
Documents: shows the number of affected/unaffected and unchecked documents over time.
-
-
Top failures: shows the most frequently occurring failures.
-
Most affected documents: shows the documents affected by the most failures.
-
Domains: provides a summary of failures, potential issues that need review and unaffected documents by domain.
Tutorial: Viewing accessibility auditor reports
-
Log in to the insights dashboard, select the Foodista results page then select accessibility auditor from the left hand menu, or click on the accessibility auditor tile.

-
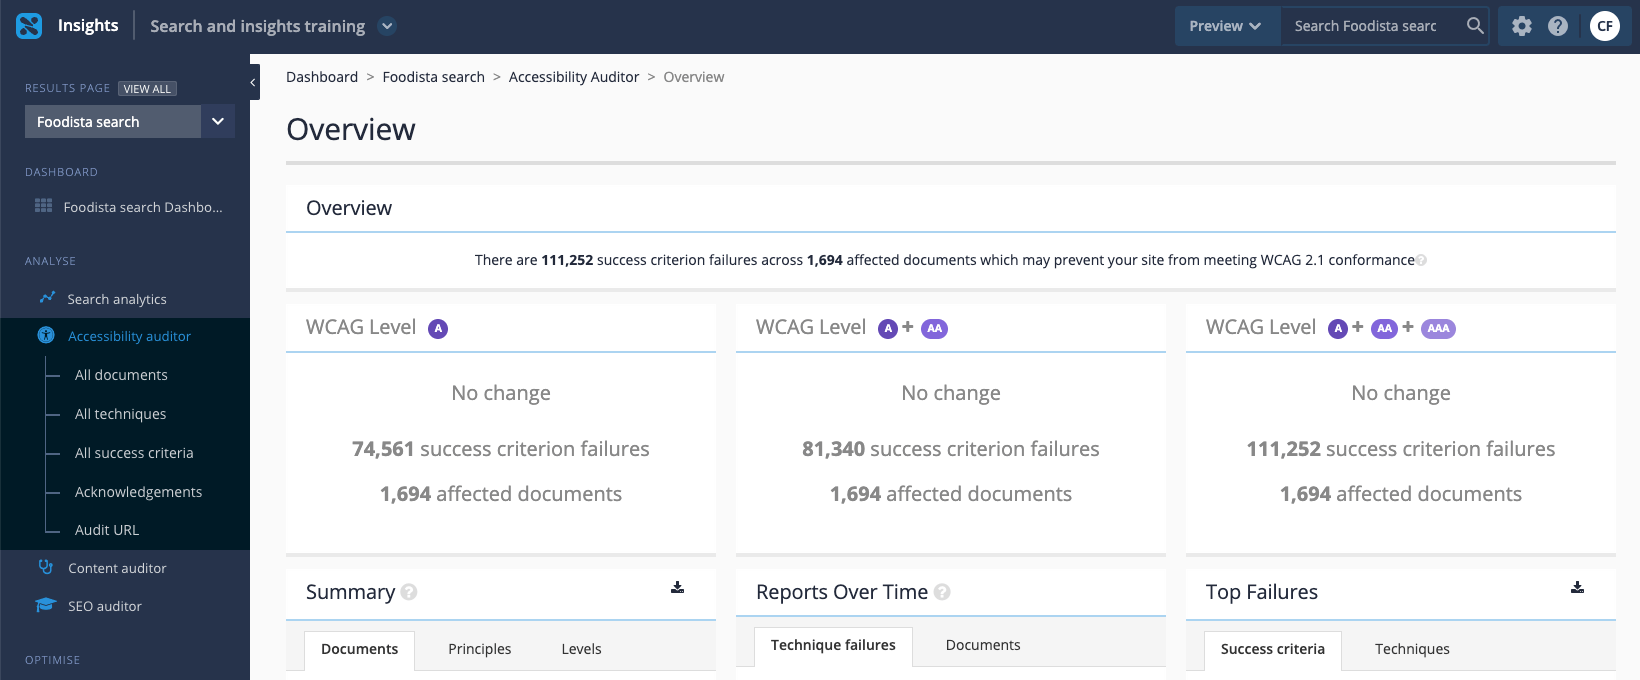
The accessibility auditor overview will load:
-
Examine the overview summary message and the summary tiles for compliance against WCAG levels A, AA and AAA.
-
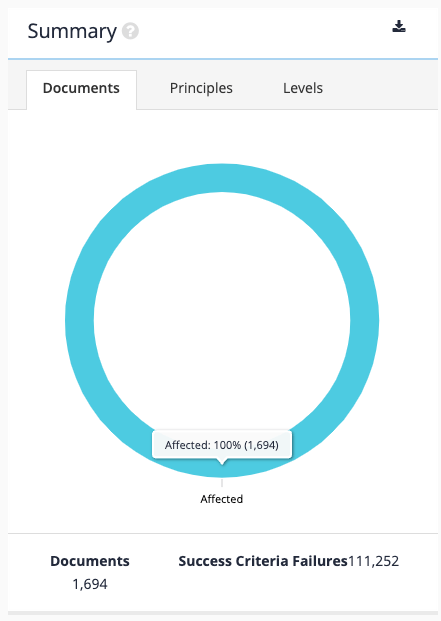
Examine the summary widget. The documents tab is selected by default showing a summary of the current document compliance.
The chart is broken down into pages affected by at least one accessibility issue, unaffected pages and documents that could not be checked by Funnelback. Clicking the help icon next to the title opens a help window.
-
Select the principles tab to see how the service rates against the four WCAG principles. The star rating is computed based on the number of documents and number of checks that Funnelback performs for each principle.
-
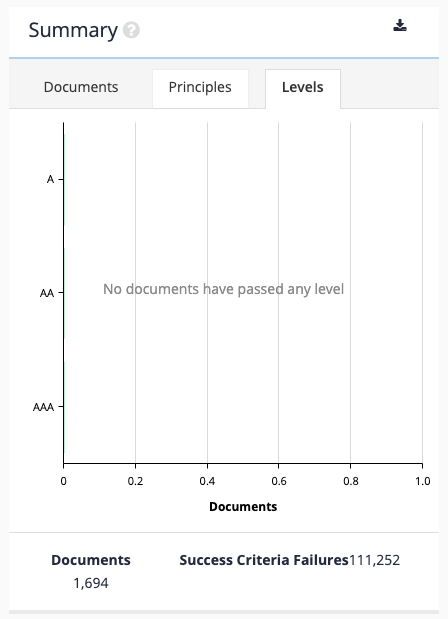
Select the levels tab for a summary of compliance by WCAG level. The bar chart plots the number of documents that attain each WCAG level.
A document is considered to have obtained a given level if all the checks performed by Funnelback for this level are successful. Note: this does not guarantee compliance at the given level as the WCAG standard includes accessibility checks that must be assessed manually.
-
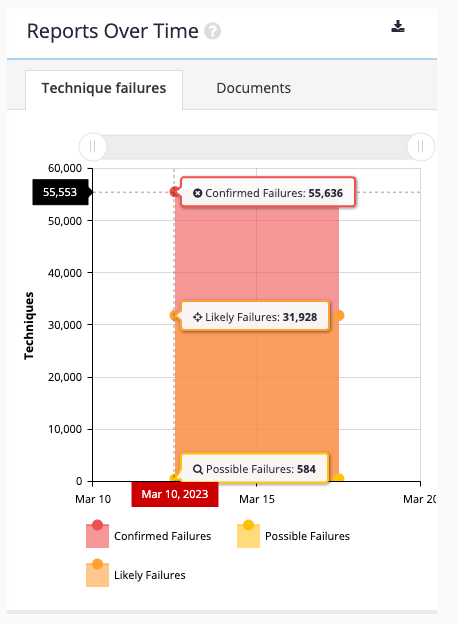
Examine the reports over time widget. By default, this widget displays the number of issues affecting the service over time. Your widget will be displaying a No data found message as the accessibility auditor has only run a single time. Once accessibility auditor runs again the screen will update to look more like the screenshot below.
-
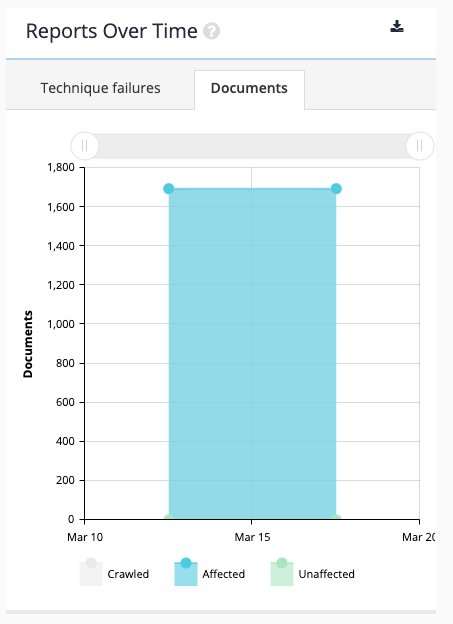
The documents tab displays the affected, unaffected and crawled documents over time.
-
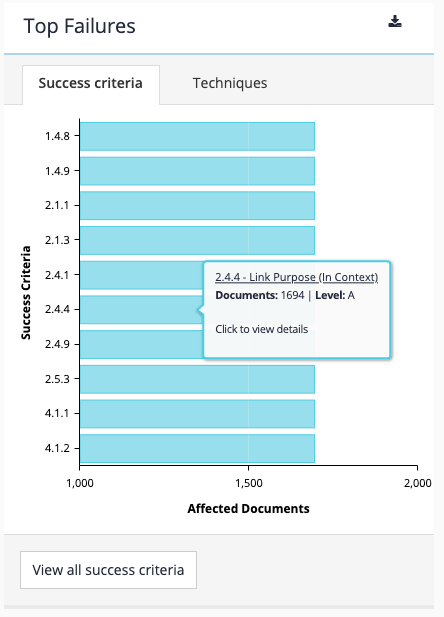
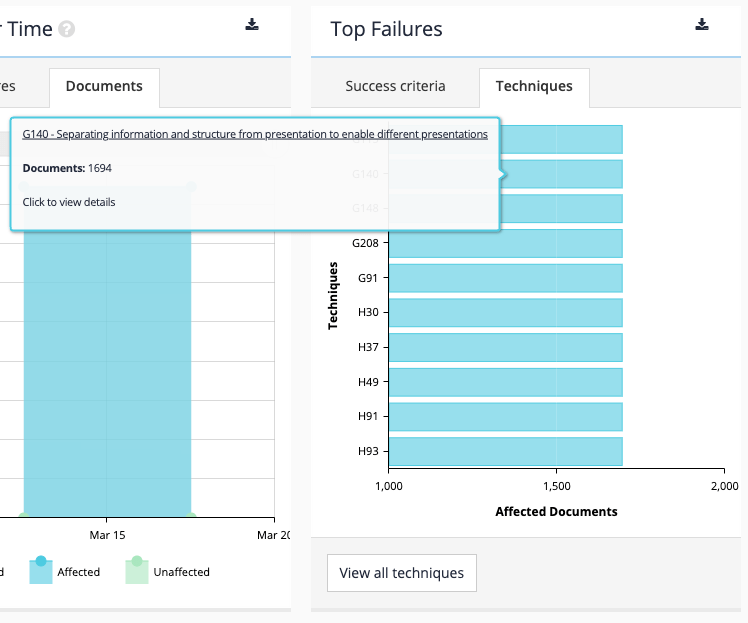
The top failures widget shows the top success criteria and technique failures that affect the service, ordered by the number of documents affected.
Opening the success criteria tab shows the top success criteria failures. More information such as the number of affected documents and WCAG level is displayed on hover.
-
The techniques tab similarly shows technique failures by the number of affected documents.
-
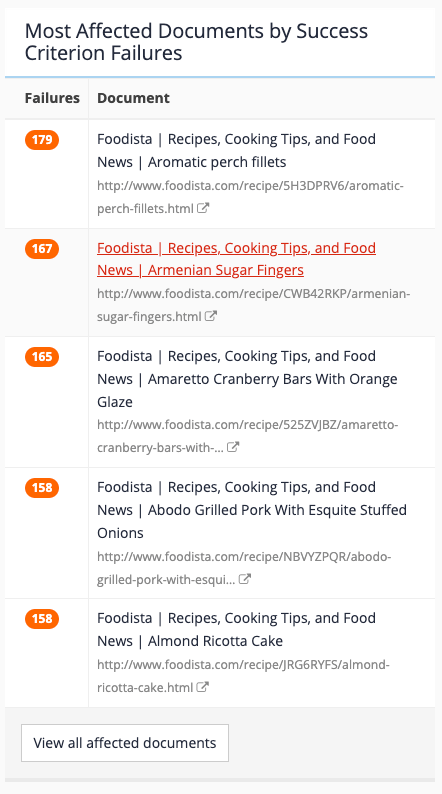
The most affected documents by success criterion failures widget lists the top five affected documents, by the number of failures detected.
Clicking view all affected documents opens the documents report.
-
The domains widget displays a summary of the failures of grouped by domain (as indicated by the document URL).
Each domain item provides a total number of documents checked and counts for the number of confirmed, likely and possible failures.
The domain list can be filtered by domain by entering a domain into the filter box.
The domain list can be sorted by domain, or by the number of documents.

-
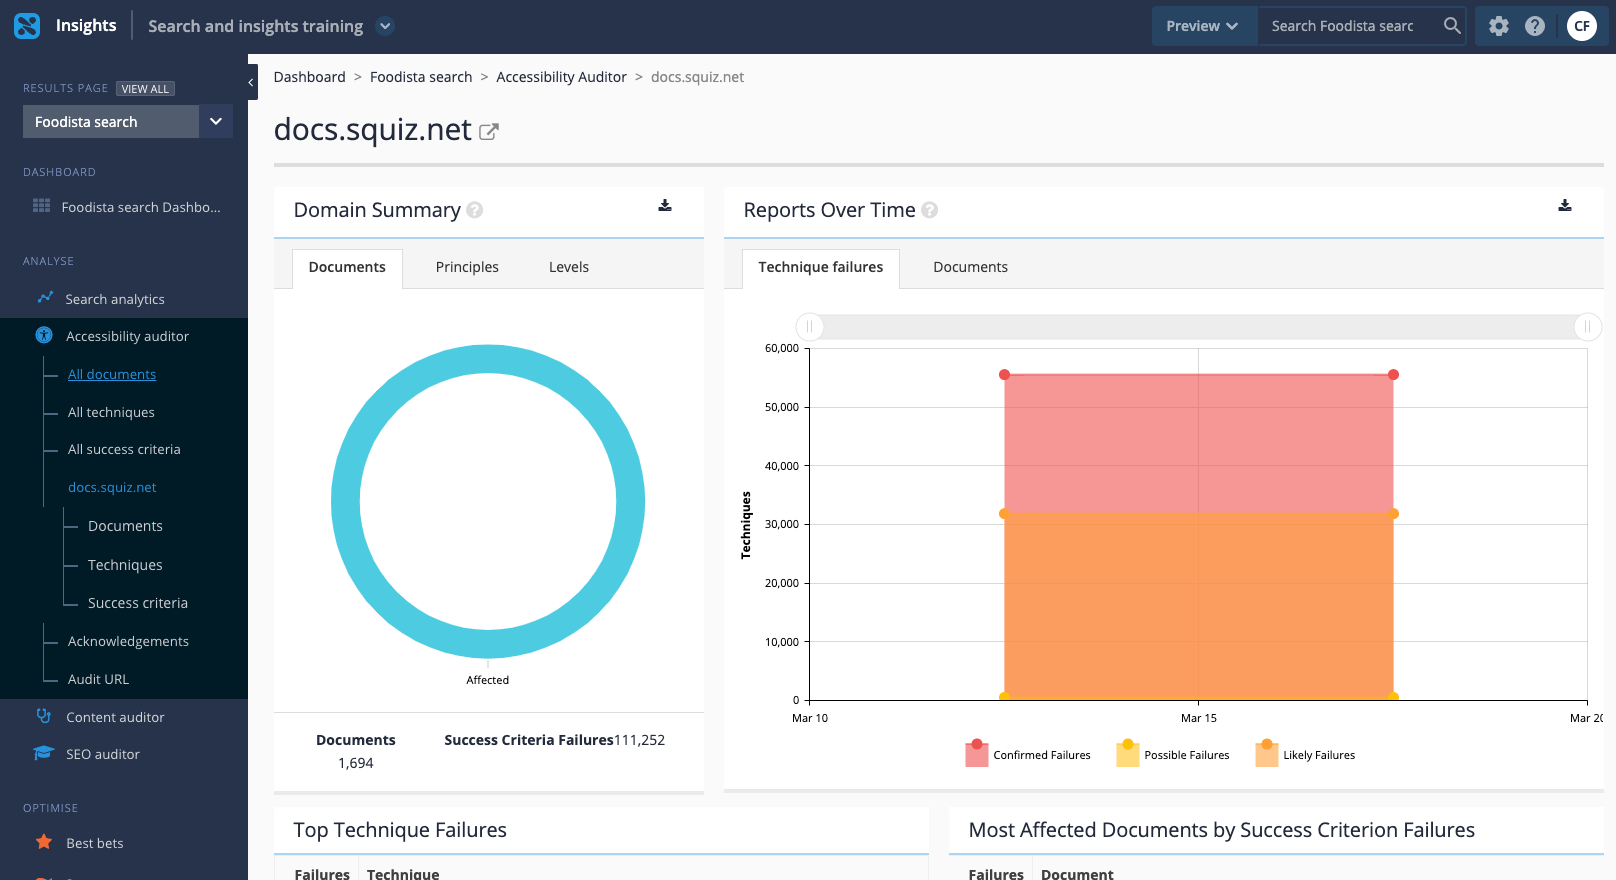
Click on a domain name to open a domain summary. The domain summary mirrors the overview report, but is limited to documents from the selected domain. Observe that the left hand menu also expands to show domain level sub-reports.
Accessibility auditor documents report
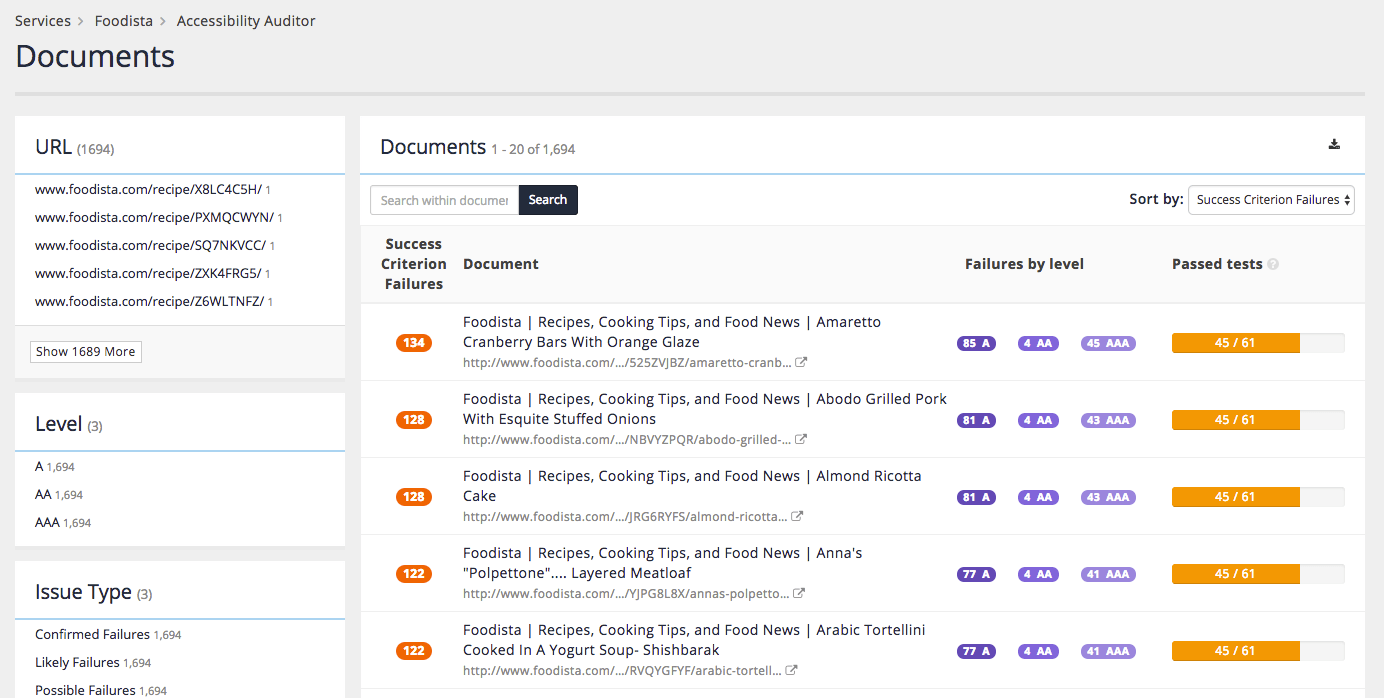
The documents report provides a document-centric view of the WCAG compliance for pages belonging to the current results page. The report lists documents that are affected by WCAG issues sorted by the number of issues.
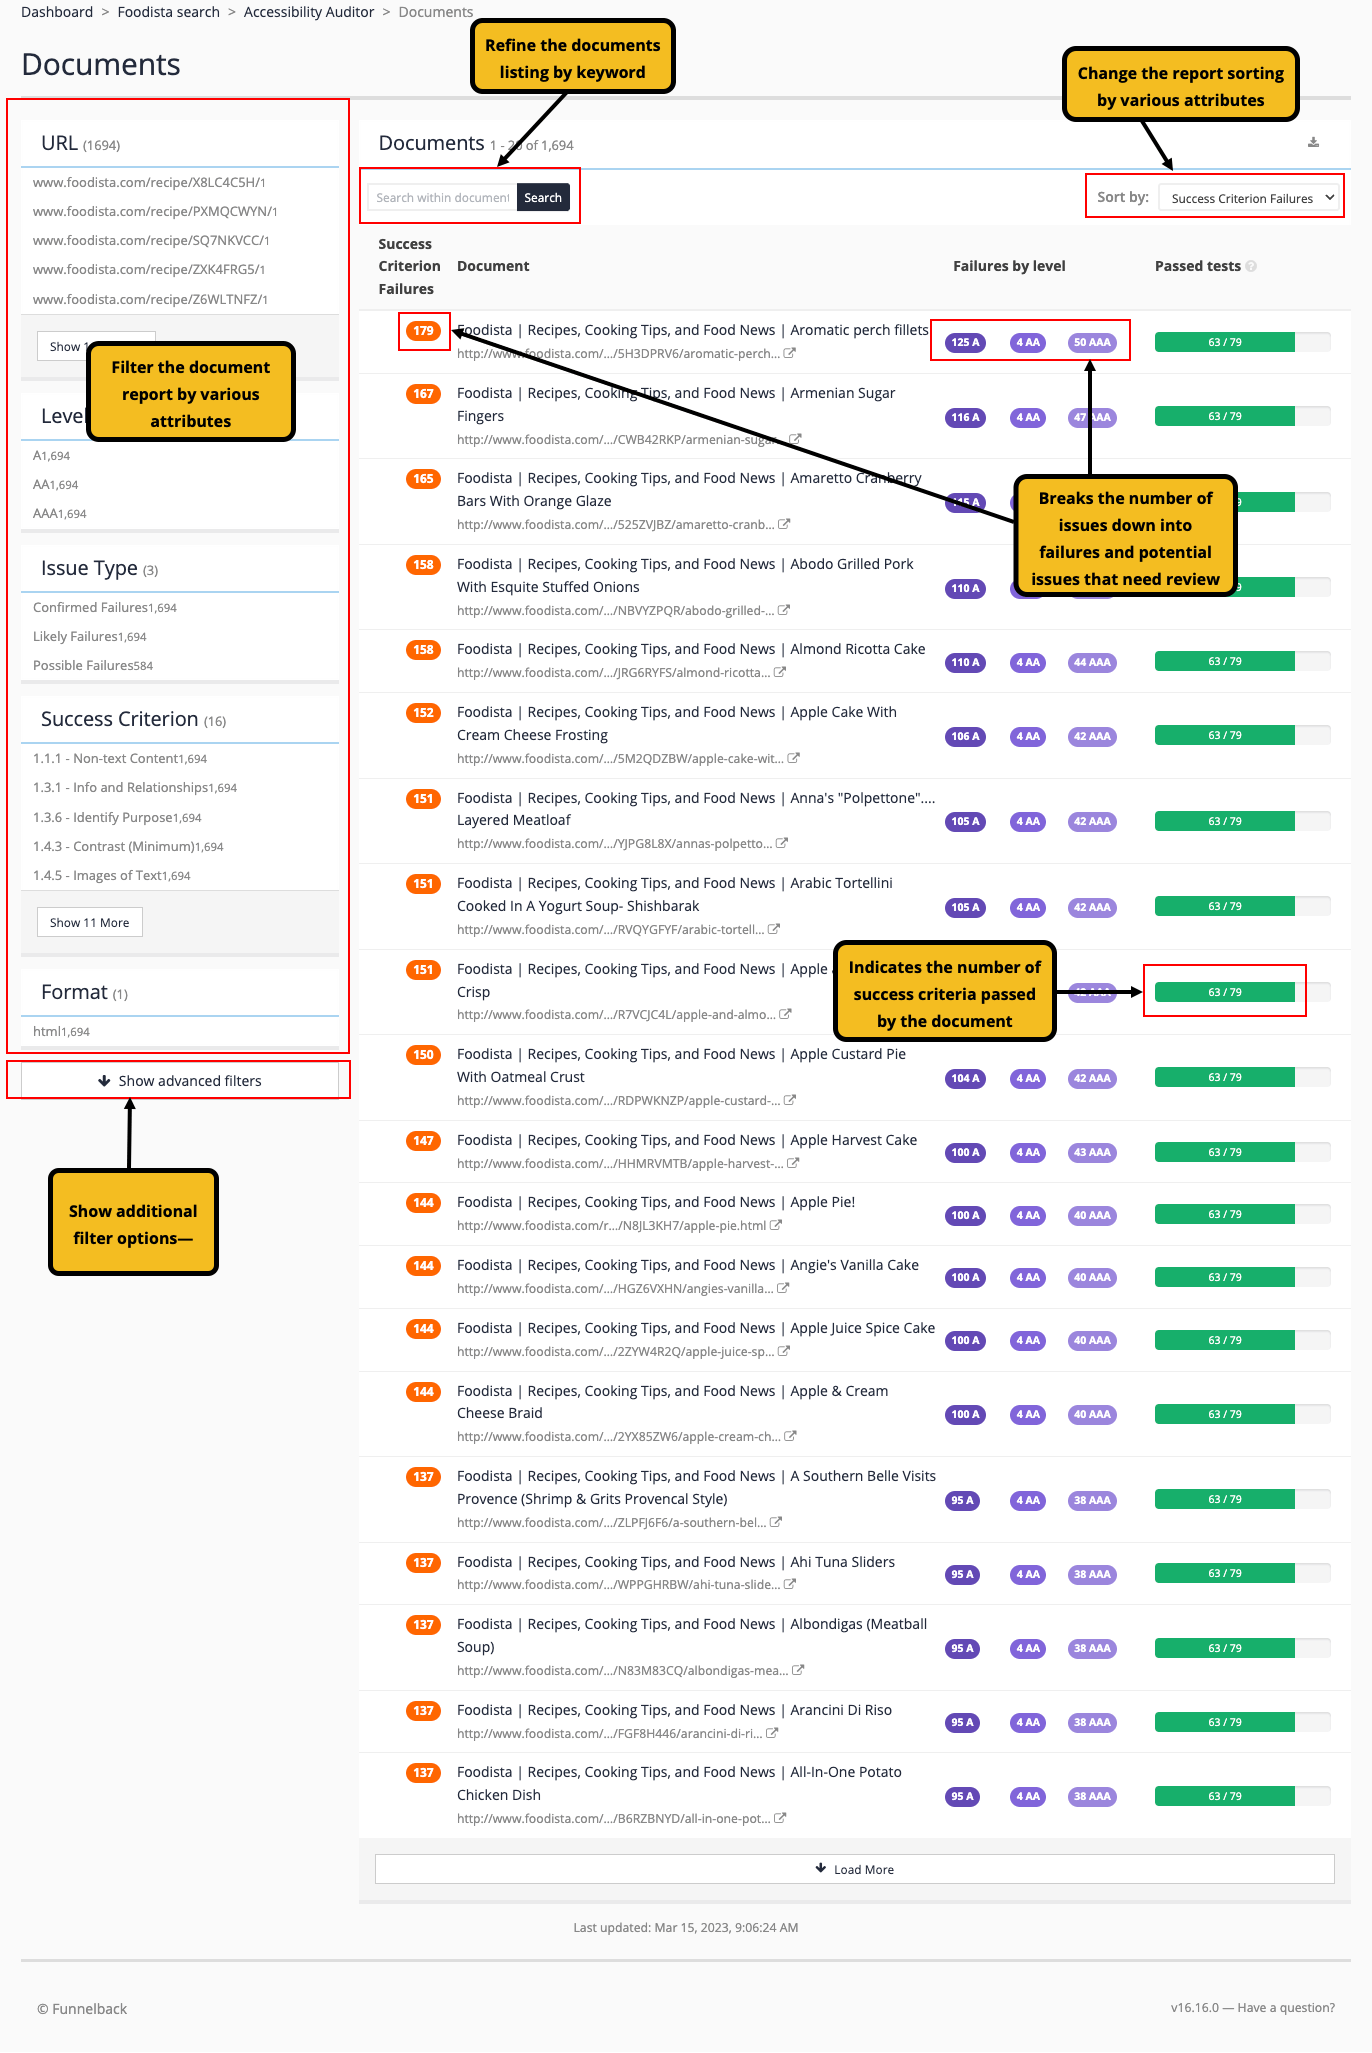
This report can be used to prioritize which documents should be fixed first. For example, reduce the total number of affected documents on a site more quickly by fixing those with fewer errors, or make high value changes by identifying and fixing errors that affect lots of pages.
The report offers a number of refinement options allowing the report to be focussed on more specific tasks. Various facets allow the documents report to be filtered by various attributes such as sub-folders (URL) or WCAG compliance level (levels). Keyword filtering is also possible and will filter the report to only documents that include the specified keyword(s).
Clicking on the document title opens the document report for that single document.
Accessibility auditor document level report
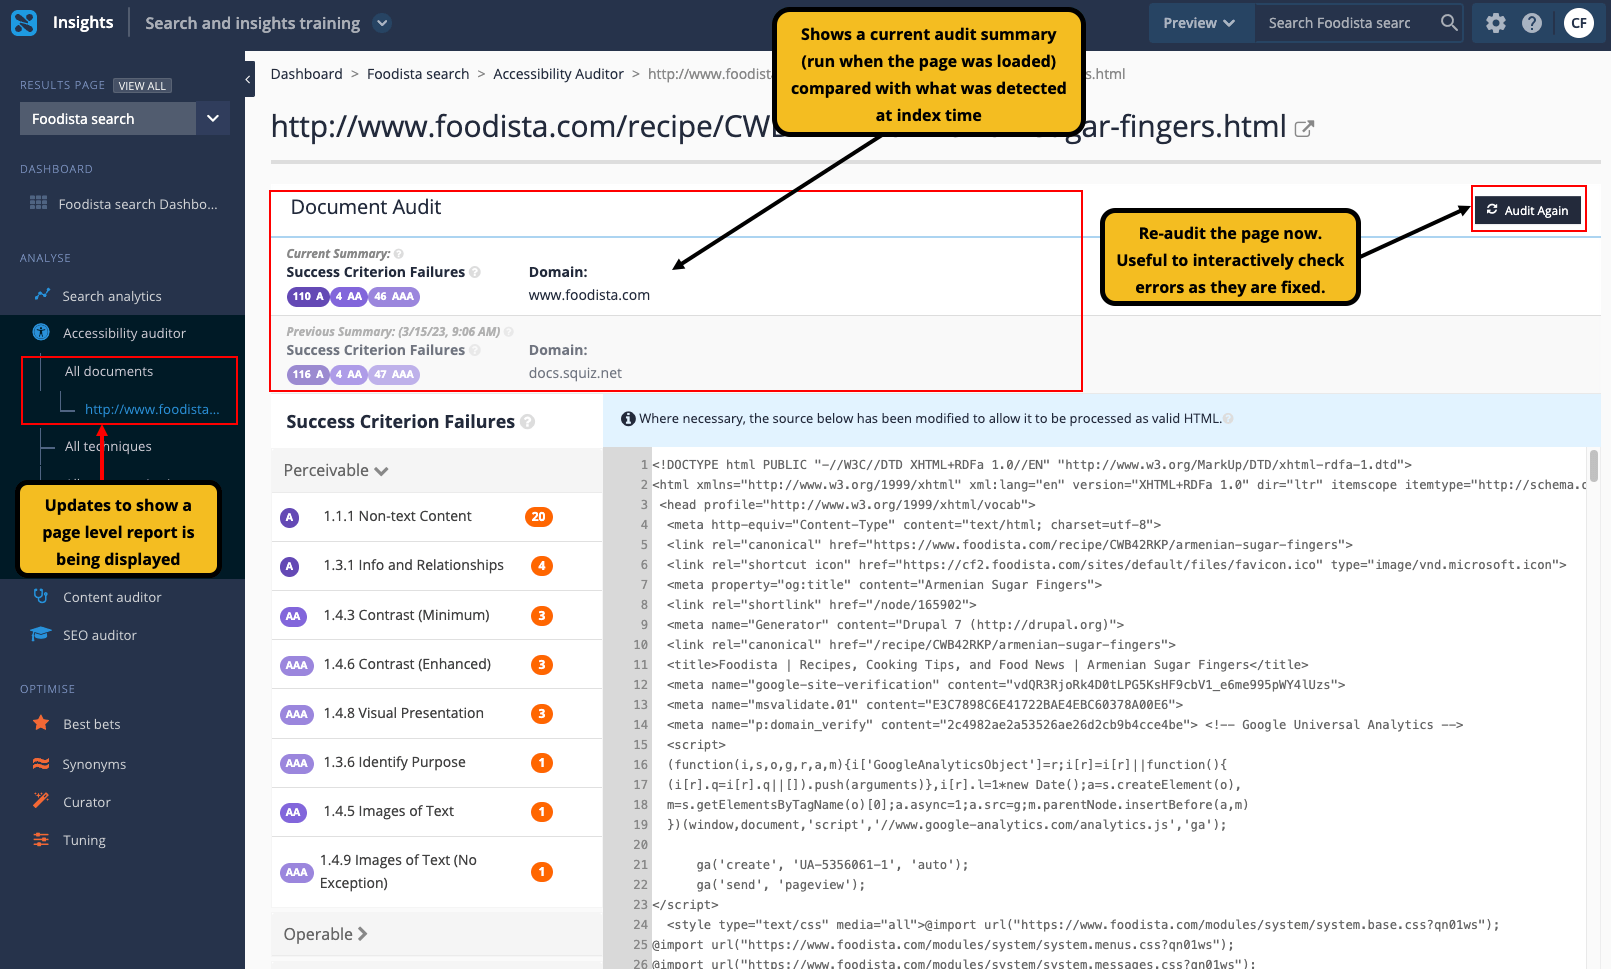
The document audit report provides detailed information on all the detected failures and issues that need review for an individual document.
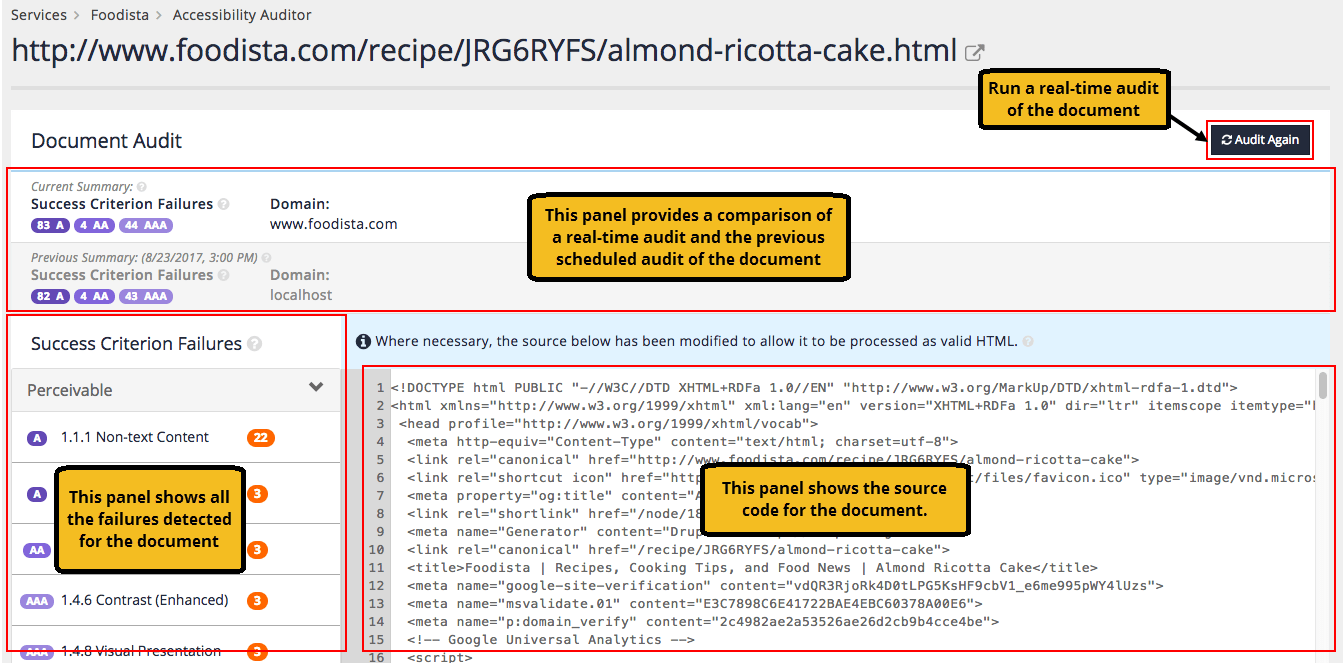
The report consists of a number of panels:
-
Document audit summary: provides an overview of the number of detected failures and issues that need review as well as the WCAG levels that the document fails to comply with.
-
Failures: lists each failure, grouped by the POUR principles, that were detected for the current page sorted by the number of times the error was detected. The issues are grouped into issues and issues that need review.
-
Source code: shows the source code of the document.
Clicking the audit again button runs a real-time audit of the document. This allows for fixes to be made to the document and the changes checked in real time.
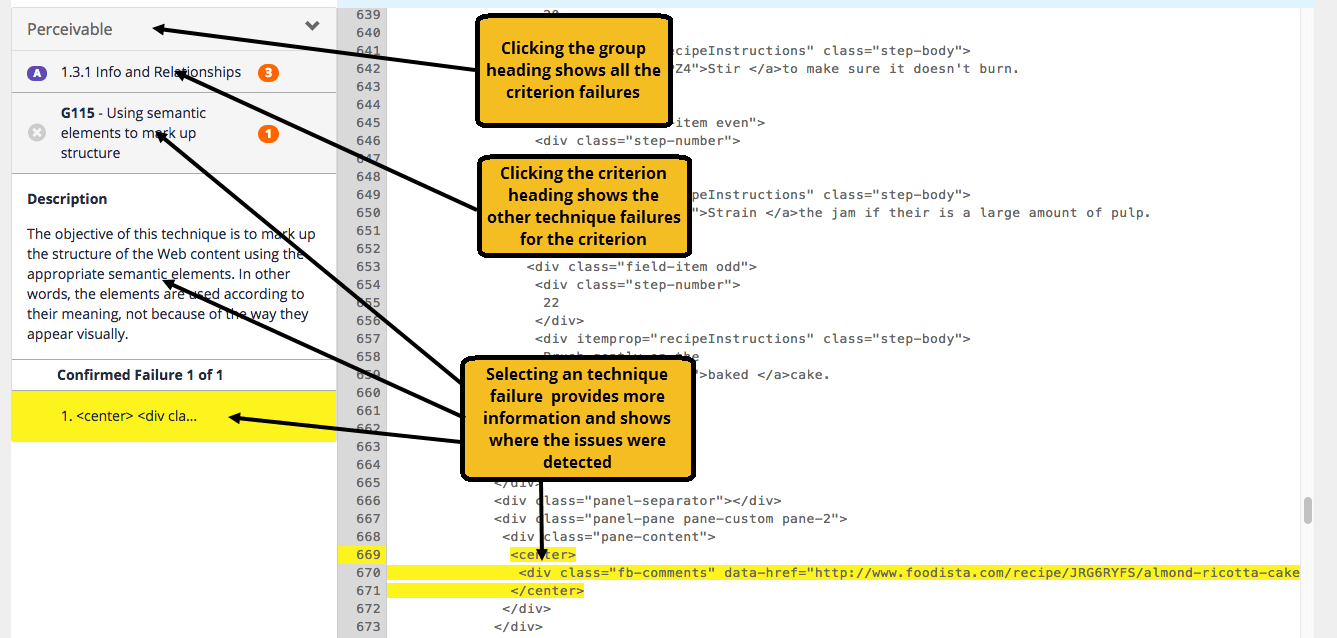
Clicking on one of the success criterion shows the different techniques that have generated failures against the criterion.

The icons on the left indicate the confidence of the machine checks:
| Icon | Name | Description |
|---|---|---|
Confirmed Failures |
The machine check is confident that this is a failure. For example, a form which does not contain a submit button. |
|
Likely Failures |
The machine check found an issue but needs a human to be sure. For example, a link which has a one word textual description such as "more" might not be specific enough, however a human could verify that it makes sense given the surrounding context. |
|
Possible Failures |
The machine check found an element in the document that usually requires extra accessibility related resources, but is unable to verify if these exist. For example, the check found a video but cannot check if it has subtitles. |
Clicking on a specific technique failure provides further information on the failure and suggested steps on how to resolve the issue. The source code also highlights the regions of code where the error was detected.
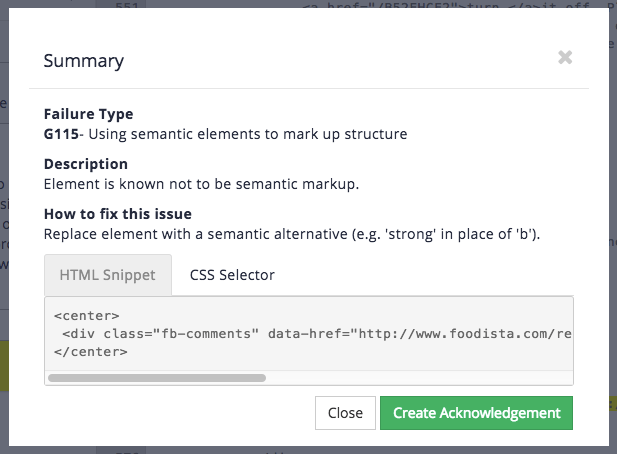
Clicking on a highlighted error or selecting view summary from the failures popup menu opens a window with information about the issue, how to fix it and also provides an administrator with an option to acknowledge the issue.

Success criteria report
The success criteria report details the affected documents broken down by success criterion. The report can be filtered by WCAG level and POUR principle allowing an administrator to focus on the failing success criteria, and thus prioritise which techniques need to be addressed to attain the desired level of WCAG compliance.
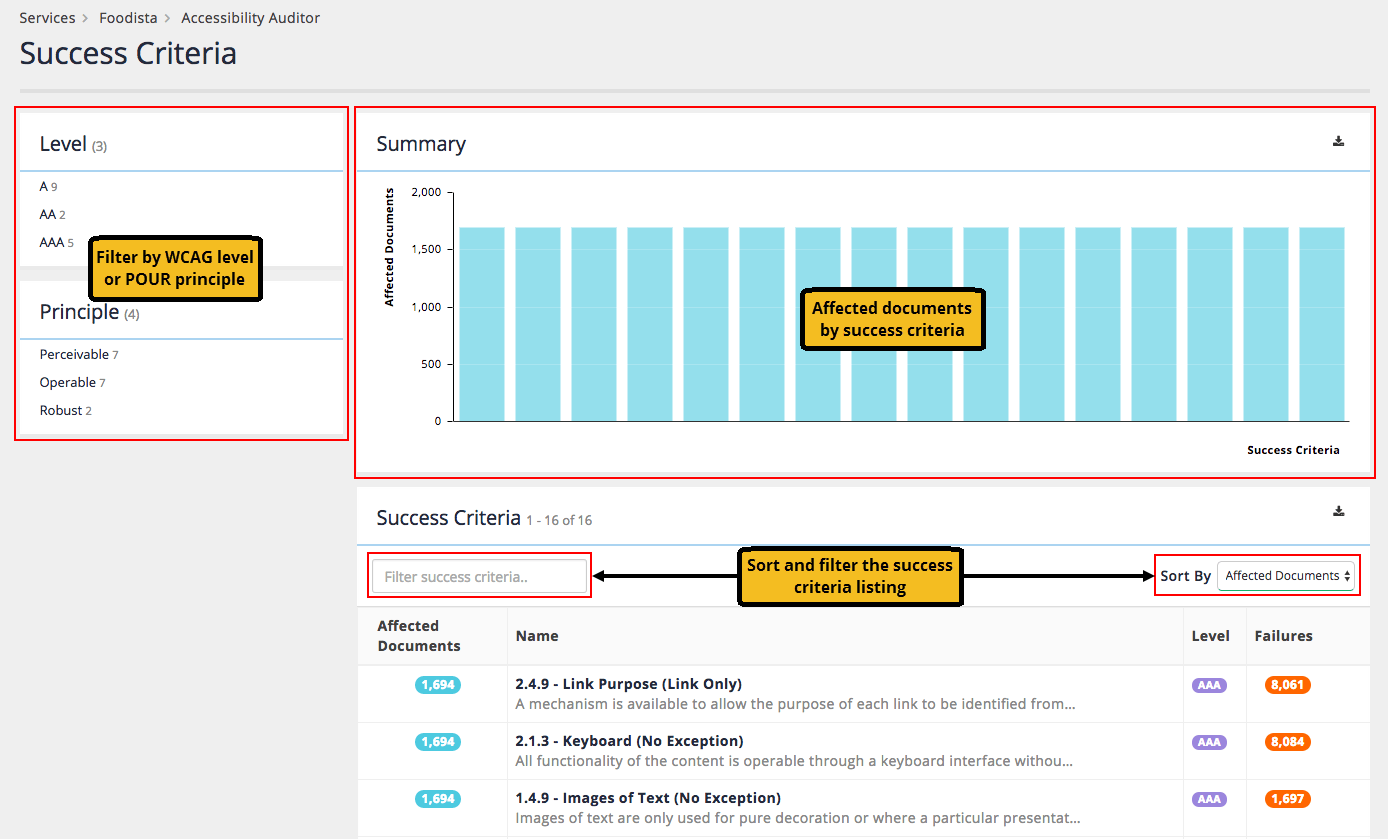
Clicking on an individual success criterion (either in the listing, or in the bar chart) opens a screen providing more detail on the specific criterion.
Techniques report
The techniques report lists failures against specific WCAG techniques.
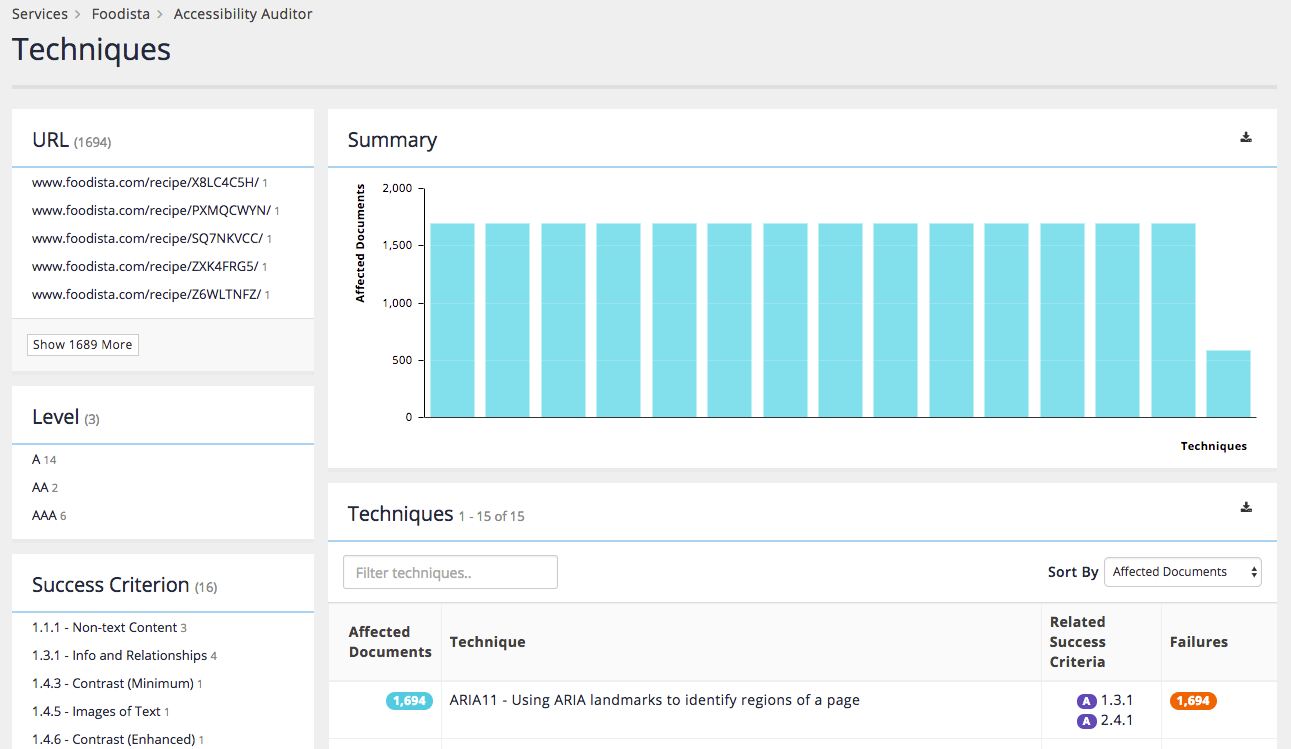
The issues can be filtered by various attributes.
The table of issues provides the issue name and number of times the issue was detected as well as information on the WCAG success criteria and levels that the issue affects.
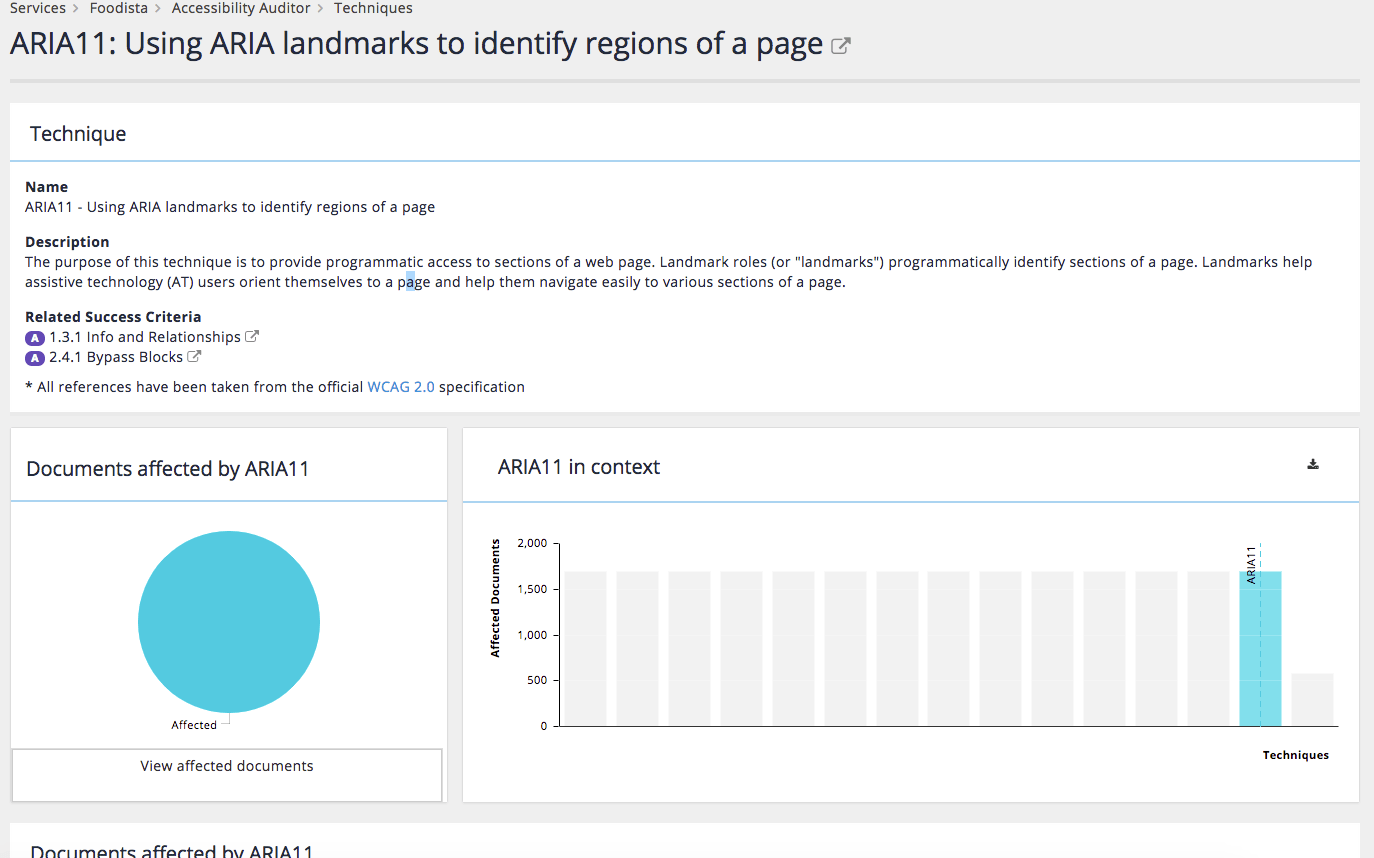
Clicking on a technique will load a technique level report showing information about the technique and pages that are affected.
Tutorial: Techniques and success criteria reports
-
Log in to the insights dashboard, select the Foodista results page then select accessibility auditor from the left hand menu, or click on the accessibility auditor tile.
-
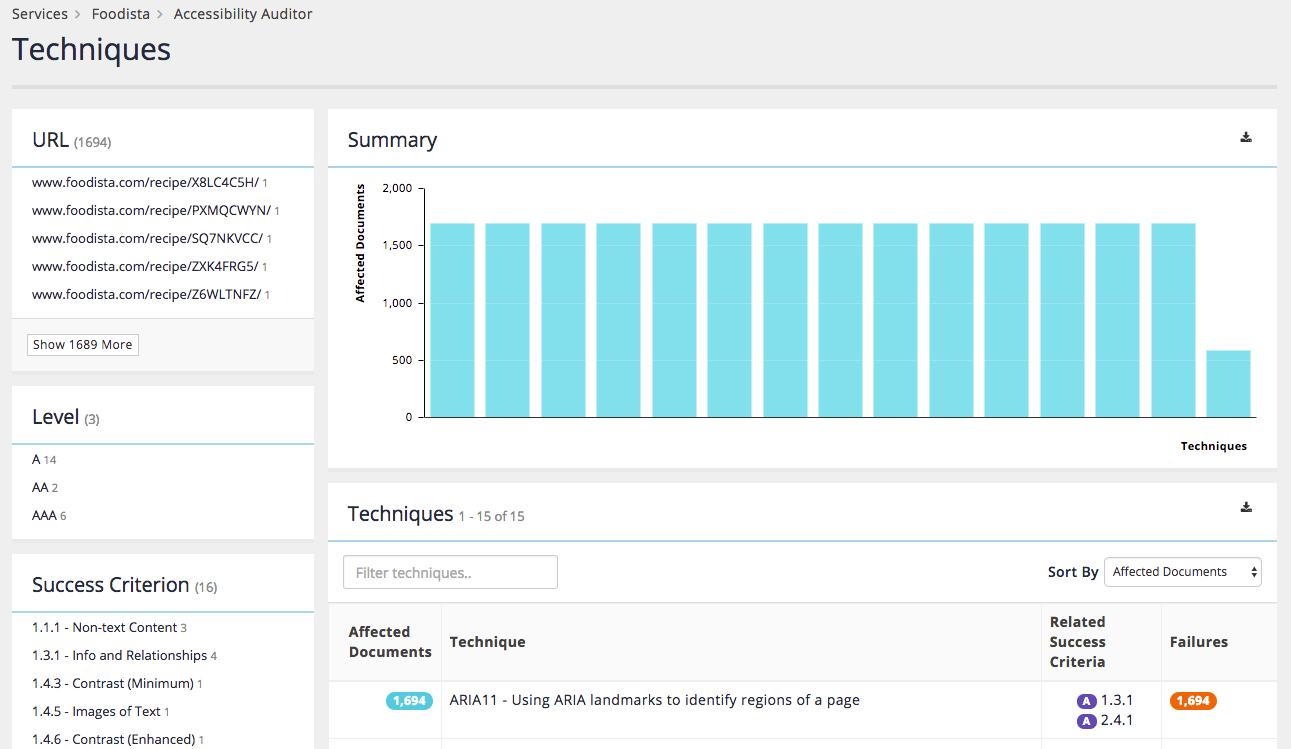
Open the techniques report by selecting all techniques from the left menu.
-
The techniques report provides similar controls to the documents report. Hovering over an issue and selecting view affected documents will open up a documents report with the current issue applied as a filter. Clicking on a success criterion will open the official WCAG documentation on the criterion.

-
The success criteria report shares the same layout, but reports on success criteria. Open the report and spend a few moments inspecting the report.
Acknowledgments
An acknowledgment can be used to manually mark an issue to be ignored. Many of the WCAG checks are not black and white and will only be an error in certain circumstances that cannot be determined by a computer.
This means that a number of checks will be marked as needs review - because manual review is required to determine if the issue is actually a failure.
When creating an acknowledgment options are available to control the scope of the acknowledgment (whether it affects just a specific occurrence or wherever the issue is found) and also to record justification for the acknowledgment (in case an audit trail is required).
Creating acknowledgments
Failures can be acknowledged from the document level report by selecting one of the acknowledged items from the failure’s popup menu, or by clicking the create acknowledgment button on the details popup window.
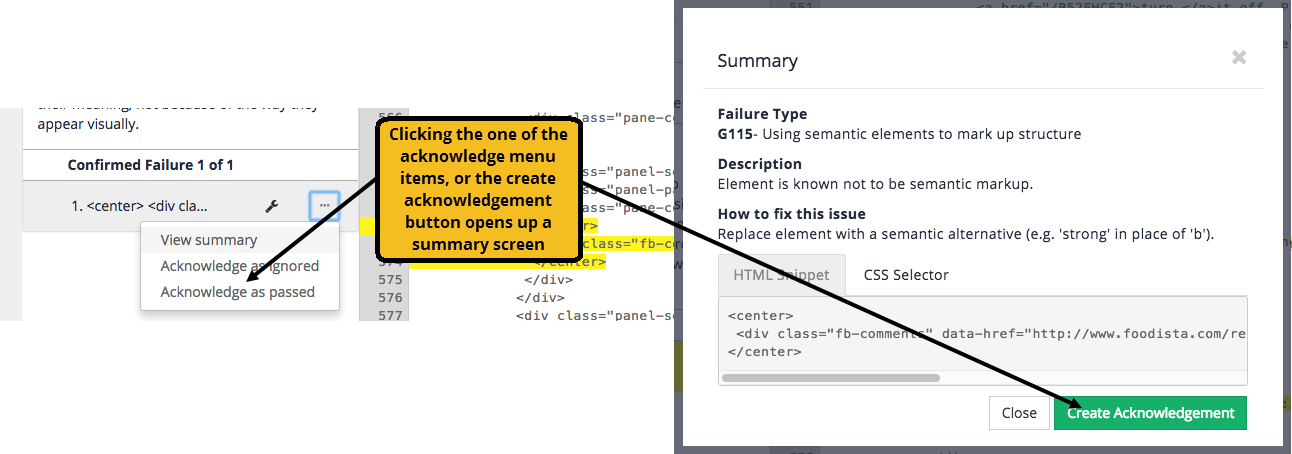
This opens the acknowledgment screen which allows the failure to be acknowledged. Options are provided to define the following:
-
Acknowledgment type: choose to ignore the failure (because perhaps you have mitigated the failure in another way) or pass the failure (because the failure is only in certain circumstances and you have verified that it’s actually a pass).
-
Reason: Provide some information justifying why the acknowledgment is appropriate (for audit purposes).
-
Scope: Define a scope for the acknowledgment - does it apply to just this specific error? anywhere the error is detected? etc.
Managing acknowledgments
The acknowledgments screen (accessed from the left hand menu) lists all the acknowledgments that have been created for the service and allows an administrator to manage the acknowledgments.

Tutorial: Documents report and acknowledgements
-
Log in to the insights dashboard, select the Foodista results page then select accessibility auditor from the left hand menu, or click on the accessibility auditor tile.
-
Open the documents report by selecting all documents from the left menu.
-
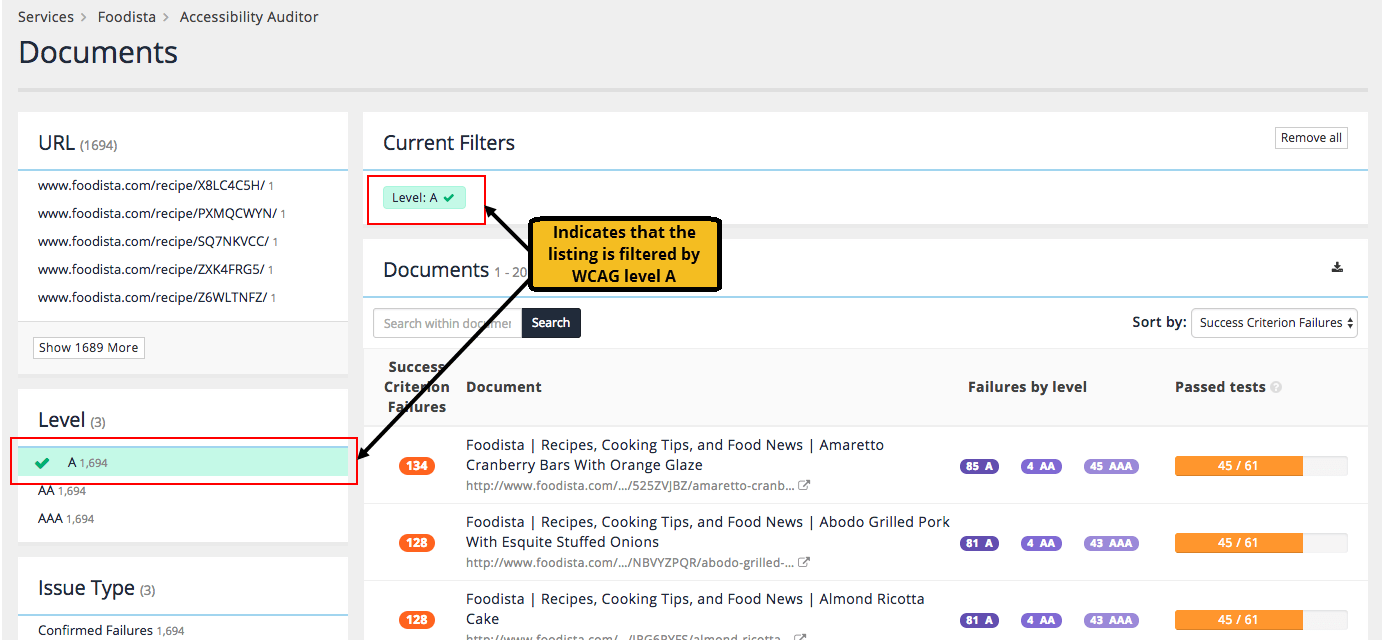
Filter the report to only include items affected by WCAG level A by selecting the A category from the level filter. The listing updates with items affected by WCAG level A issues and an indication that the report is filtered to WCAG level A.
-
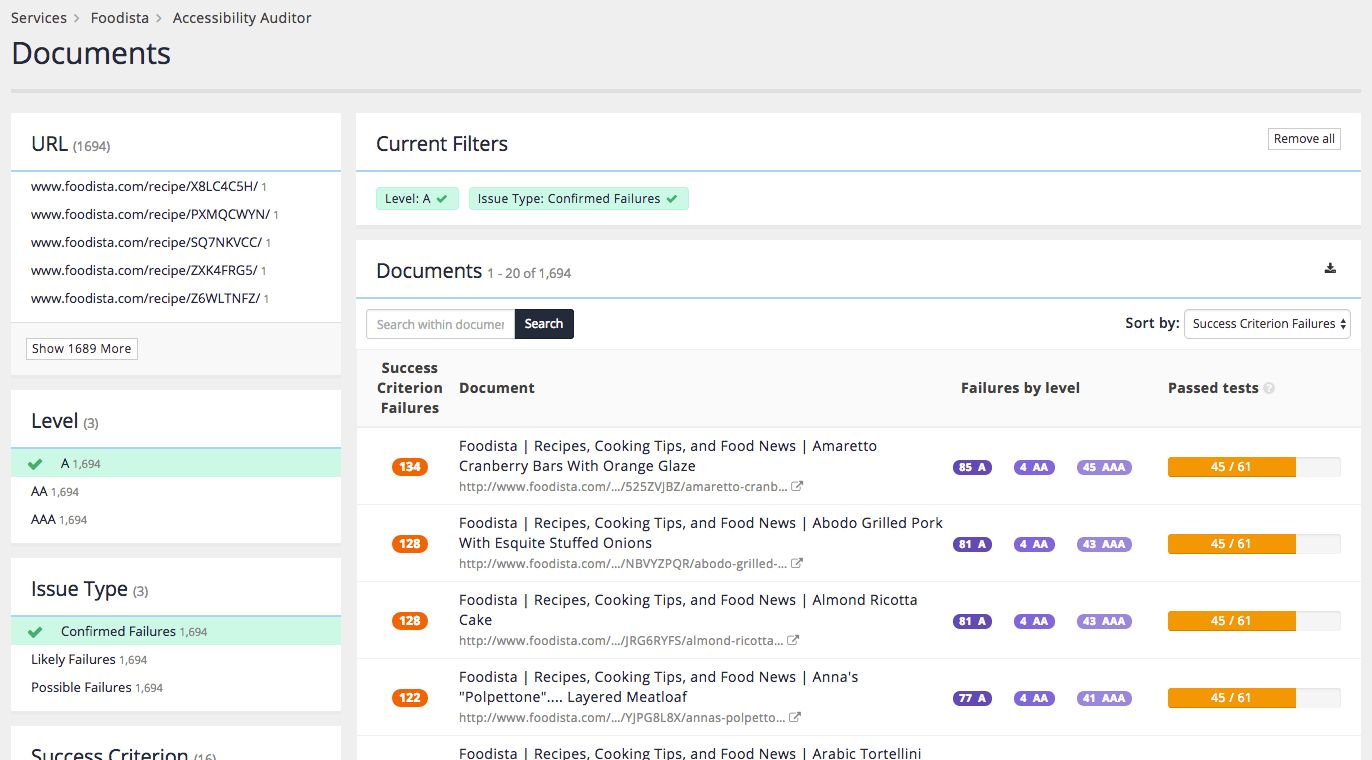
Apply an additional filter to show only the items that contain a confirmed failure. Select the failure category from the issue type filter. Observe that the applied filters update.
-
Select one of the affected documents to load the document-level report.
-
The success criterion failures panel displays all the detected issues, grouped by the four principles and sorted by the number of times the issue was detected in the page. Click on a success criterion to show the individual techniques that have had failures detected.
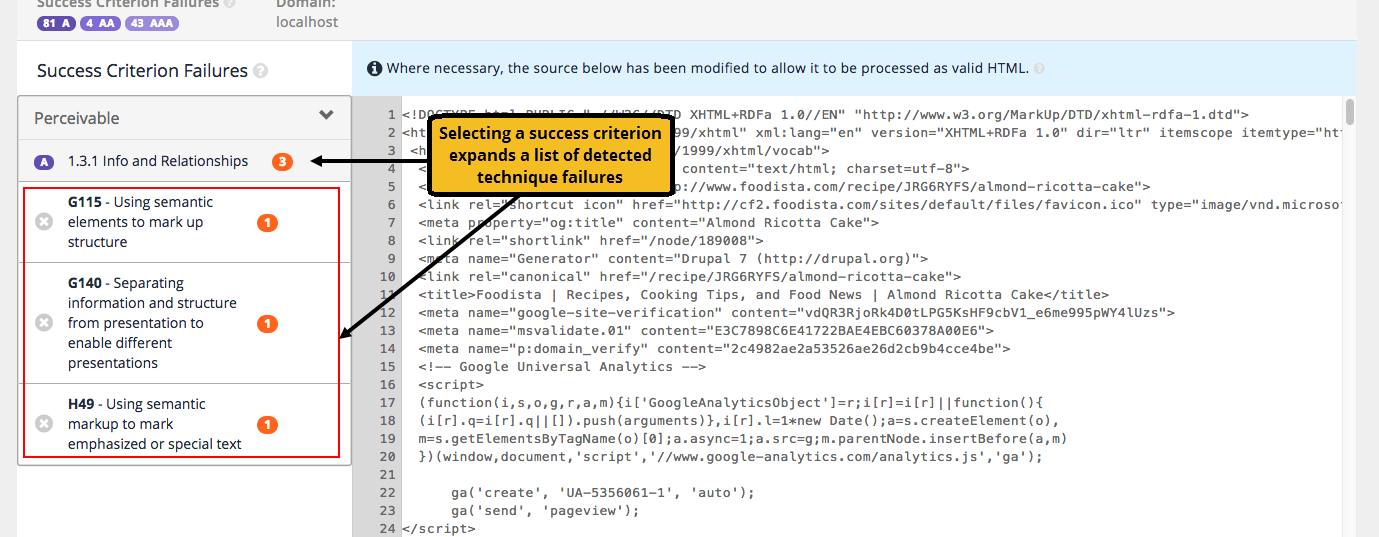
-
Find out more about an individual technique failure and how to fix it, or tell Funnelback to ignore the failure by clicking on the highlighted region within the source code. Before clicking on the issue make a note of which issue you are selecting.
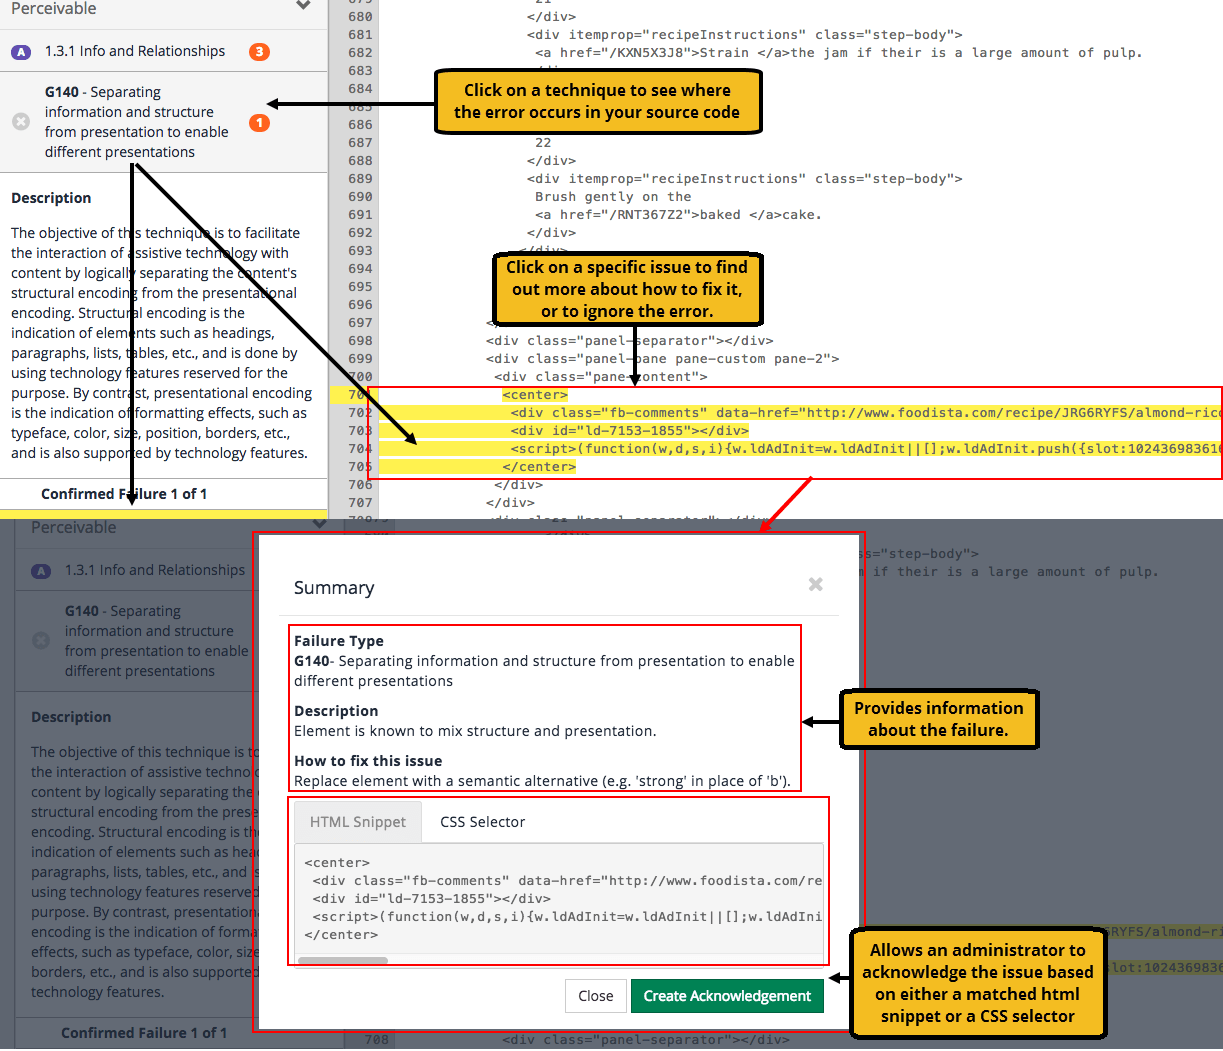
Acknowledging an issue instructs Funnelback to ignore the issue when future checks are performed.
When acknowledging an issue a number of things need to be defined:
-
How this failure should be acknowledged within a page - by a CSS selector, fragment of HTML or for every occurrence of the failure. This allows an acknowledgement to be created that selects multiple occurrences of the failure within the page.
-
The scope of acknowledgement needs to be defined - allowing the error to be ignored everywhere, only on pages within the current domain or just on the current page.
-
A reason justifying why the acknowledgement is acceptable. This provides some basic auditing that can be used to explain why an acknowledgement was created and who created it.
-
-
Create an acknowledgement for the selected failure. Enter a reason into the dialog then press the save button to return to the document view.
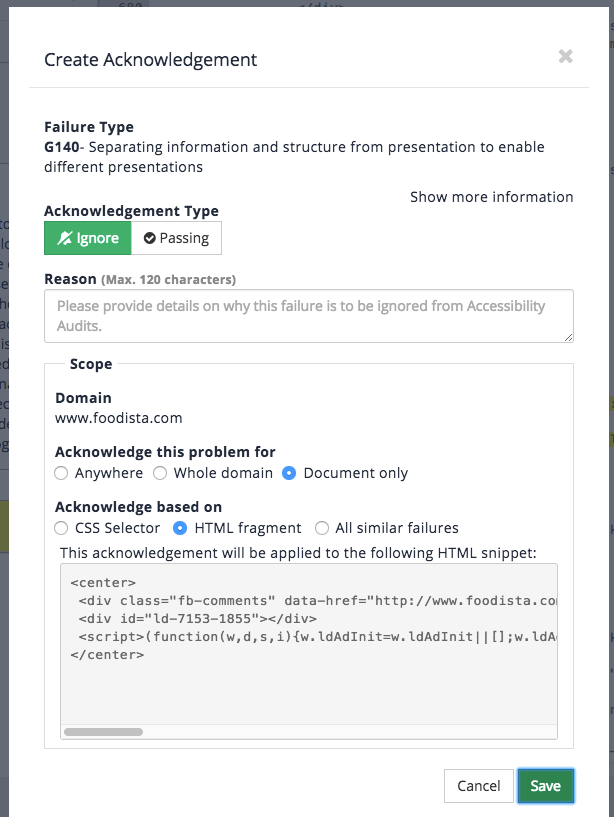
-
Locate the issue that was just acknowledged and observe that the it is now marked as acknowledged.

-
Observe that the issue that was acknowledged is now highlighted blue.

-
Click on the acknowledged criterion or the edit control for the criterion to edit or delete the acknowledgement. Clicking the view acknowledgement menu item or clicking on the blue highlighted code opens the acknowledgement editor.

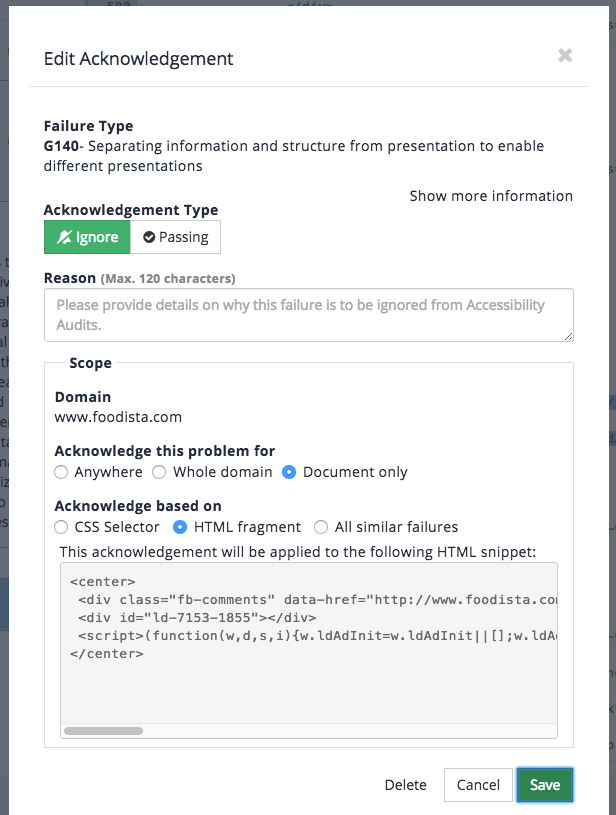
Click on the acknowledgements link in the left hand menu to list all the active acknowledgements. Edit an acknowledgement by clicking on the label in the issue type column. Delete the acknowledgement by clicking on the delete icon.

SEO tool
The search engine optimization (SEO) auditor is a tool that can be used to help explain and improve the search ranking of a specific page for specific keywords.

The audit report is displayed after a URL and keyword is entered. The SEO auditor report is broken into three main sections:
-
Summary
-
Top ranked results
-
Optimization tips
SEO auditor summary
The SEO auditor summary provides summary information about the document and how it performs for the specific query.
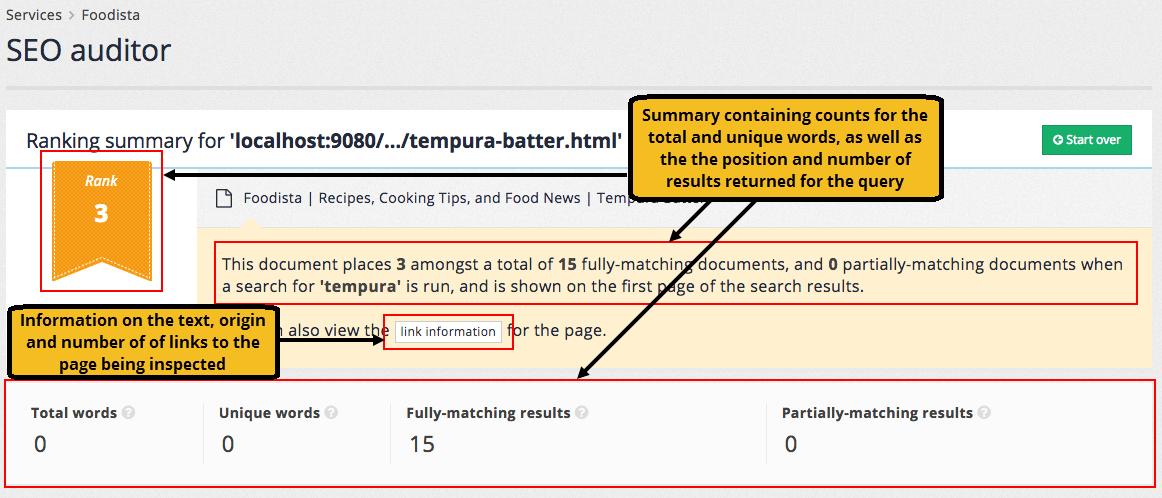
The summary also provides information on the number of indexable words found within the document, broken into the total number of words and number of unique words.
The start over button allows a new SEO audit to be performed on a different URL and set of keywords.
SEO auditor top ranked results
The top ranked results section provides a comparison between the page of interest and the top 10 results for the query.
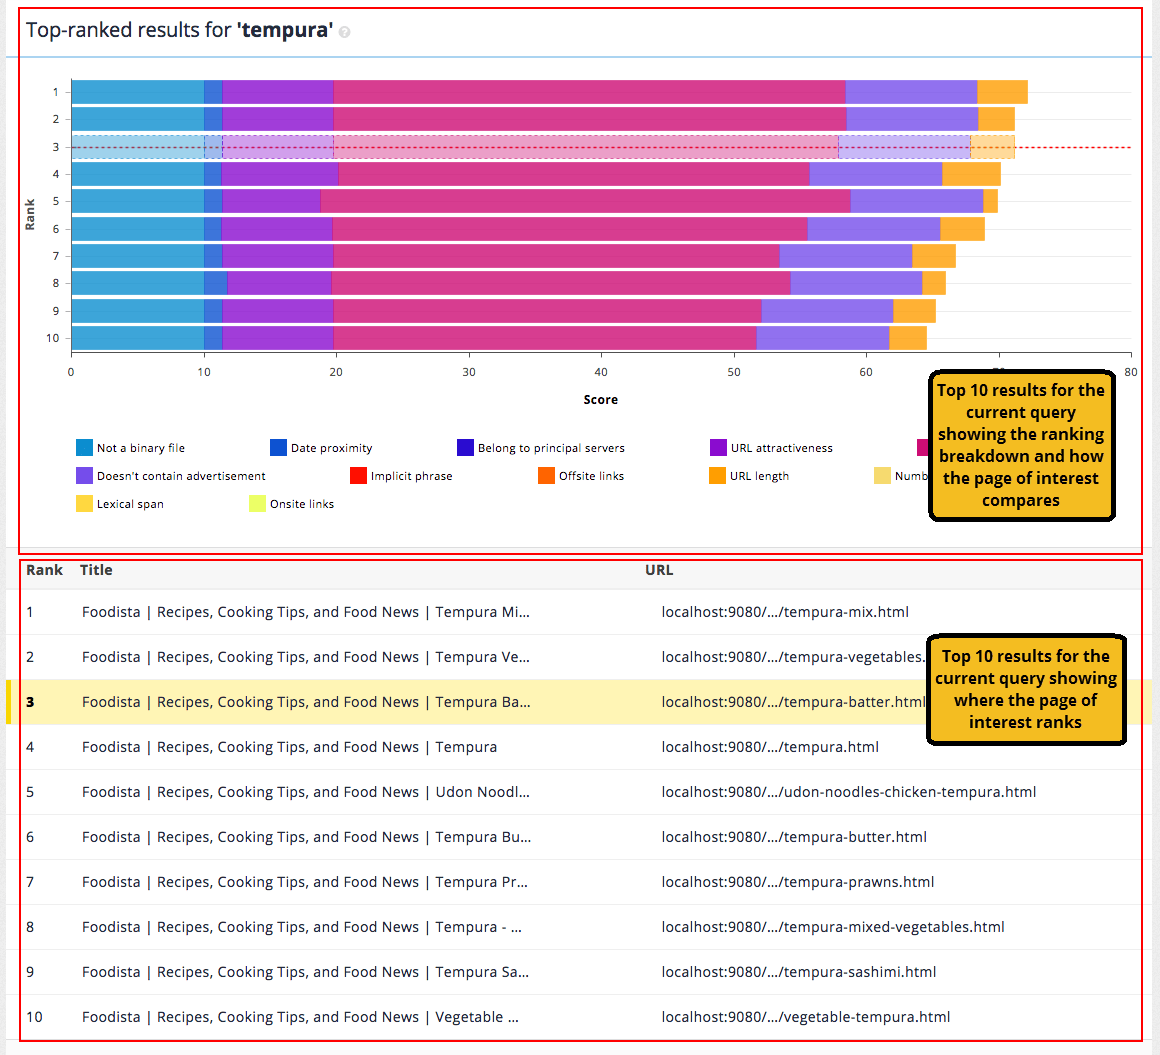
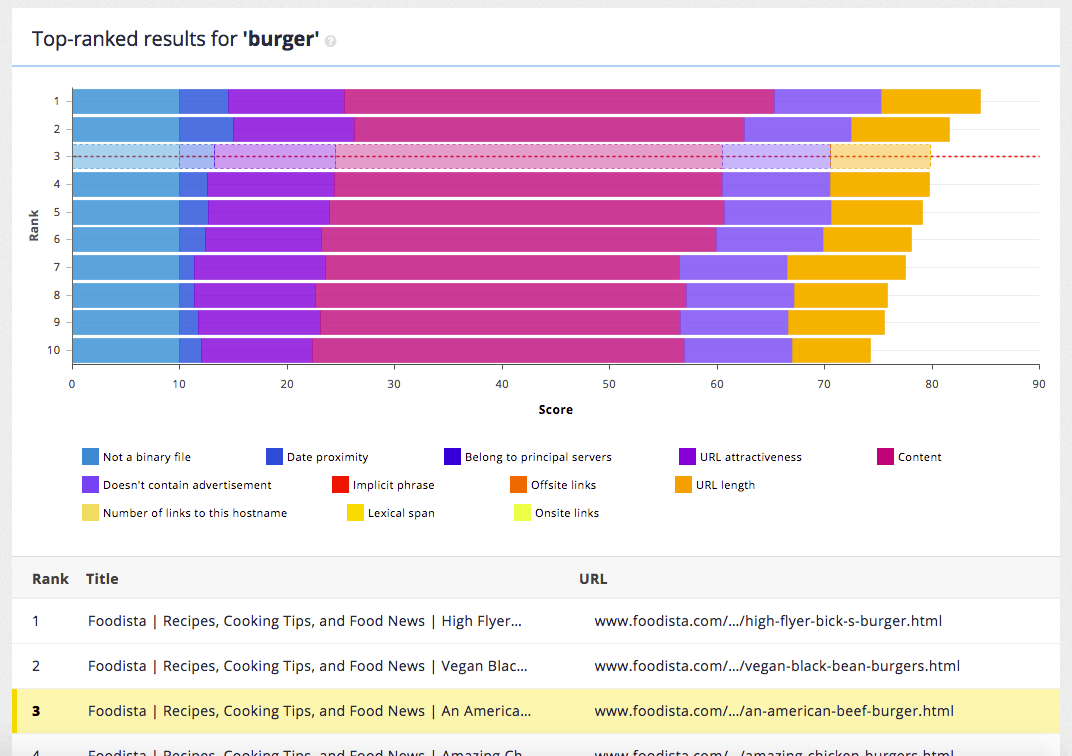
The chart provides a breakdown of the factors that influence the ranking score for the page of interest and each document in the top 10 results.
The colors on the bar chart correspond to various signals in the ranking algorithm, showing you what proportion of the final score came from the signal.
The signals included in the bar chart are:
- Belong to principal servers
-
This component of the score indicates if the document is on a principal server. Principal servers (for example, www hosts) are considered more important than subdomains. The
cool.20ranking parameter adjusts how much influence this has on the overall score.
- Content
-
This component of the score is a result of the content contained within the document. This is more that just the words that appear in the document and includes things like metadata and words used in incoming links. The
cool.0ranking parameter adjusts how much influence this has on the overall score.
- Date proximity
-
This component of the score is an indicator of how close the document’s date is to the current date. The
cool.5ranking parameter adjusts how much influence this has on the overall score.
- Doesn’t contain advertisement
-
This component of the score is an indicator of if the document contains any advertisements. The
cool.11ranking parameter adjusts how much influence this has on the overall score.
- Implicit phrase
-
This component of the score is based on the amount of implicit phrase matching within the document. If you have a multi-word query and those words are found next to each other in a document it gets a higher score. The
cool.12ranking parameter adjusts how much influence this has on the overall score.
- Lexical span
-
This component of the score is similar to the implicit phrase score but is based on how close together the query words appear in the document’s text. The
cool.67ranking parameter adjusts how much influence this has on the overall score.
- Not a binary file
-
This component of the score is based on if the document is a binary or non-binary file. The
cool.10ranking parameter adjusts how much influence this has on the overall score.
- Number of links to this hostname
-
This component of the score is similar to the incoming link scores, but is based on the volume of links to the page’s domain. Sites with more incoming links are considered more important and get a boost in the ranking. The
cool.20ranking parameter adjusts how much influence this has on the overall score.
- Offsite links
-
This component of the score is based on the number of off-site incoming links containing your search terms. Links from another website are considered a vote of confidence in the page and this provides a boost to the score based on the volume of linking. The
cool.2ranking parameter adjusts how much influence this has on the overall score.
- Onsite links
-
This component of the score is based on the number of on-site incoming links (from the same domain) containing your search terms. Similar to off-site links, the more incoming links to the page indicates that the page is more important. The
cool.1ranking parameter adjusts how much influence this has on the overall score.
- URL attractiveness
-
This component of the score is based on some heuristics that are applied to document URL. For example, some pages (such as home pages) are considered more important content. The
cool.6ranking parameter adjusts how much influence this has on the overall score.
- URL length
-
This component of the score is based on the length of the document URL. In a traditional website longer links generally indicate a deeper (and less important) page. The
cool.3ranking parameter adjusts how much influence this has on the overall score.
| a downwards pointing arrow next to the rank on the Y-axis indicates that the result has had a score penalty applied due to a result diversification match (such as same site suppression). |
Hovering over the results in the table provides a quick audit button allowing an SEO audit to be performed for the specific result, with the current query.

SEO auditor optimization tips
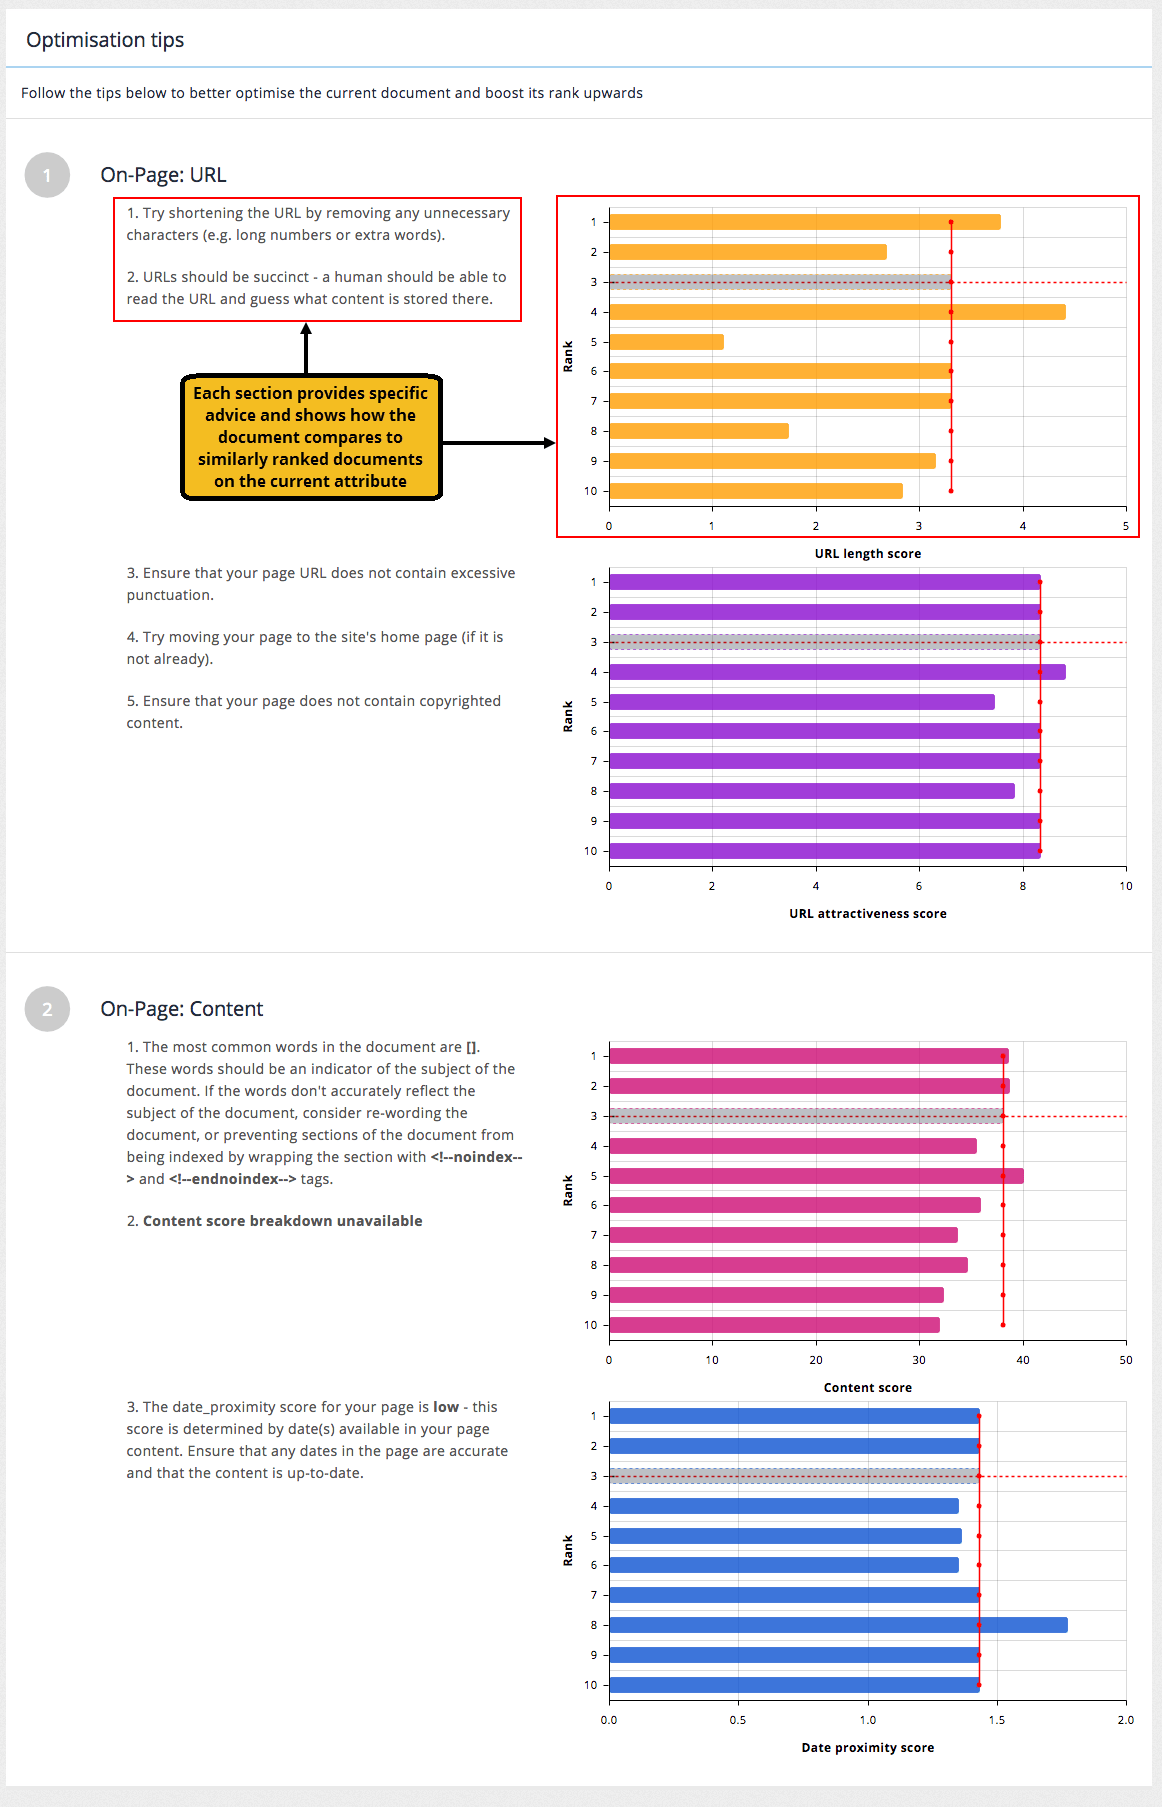
The final section of the SEO auditor report provides optimization advice on how to improve the ranking of the page of interest.
The section is broken into a number of sub-topics that provide advice and charts showing how the page of interest compares to the top 10 results for the specific ranking factor.
Tutorial: SEO auditor
-
Open the insights dashboard and select the Foodista search results page. The SEO auditor can be accessed by clicking on the SEO auditor link in the left hand menu, or by entering a URL and search query into the SEO auditor tile. Click the SEO auditor link in the left hand menu to open the SEO auditor.
-
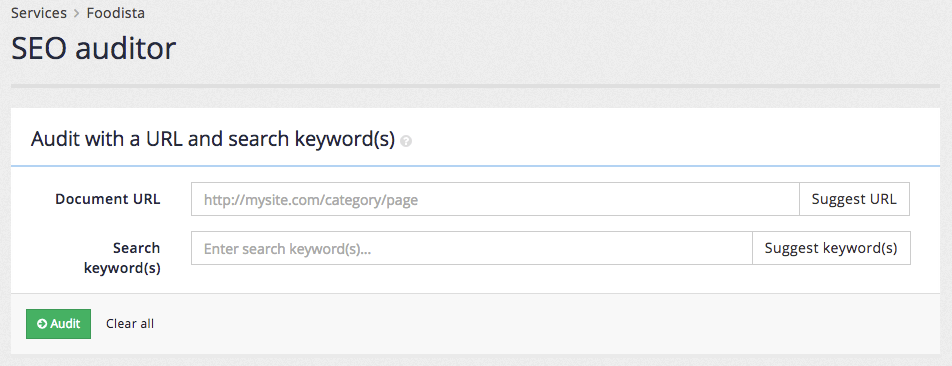
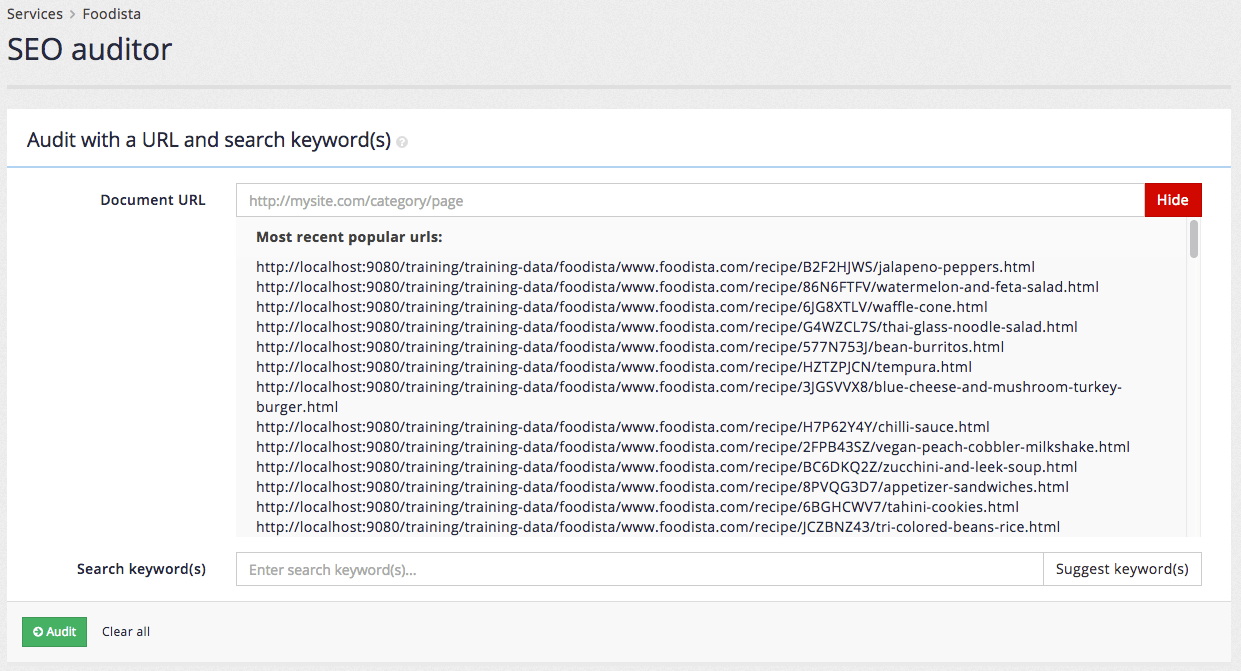
Enter a URL for analysis. This can either be input directly or by clicking the suggest URL button. Normally you will already have a URL in mind before using the tool so it can be input directly. Click suggest URL to see a list of suggestions. Click one of the URLs and this will appear in the URL field. Press the hide button to close the suggestions.
-
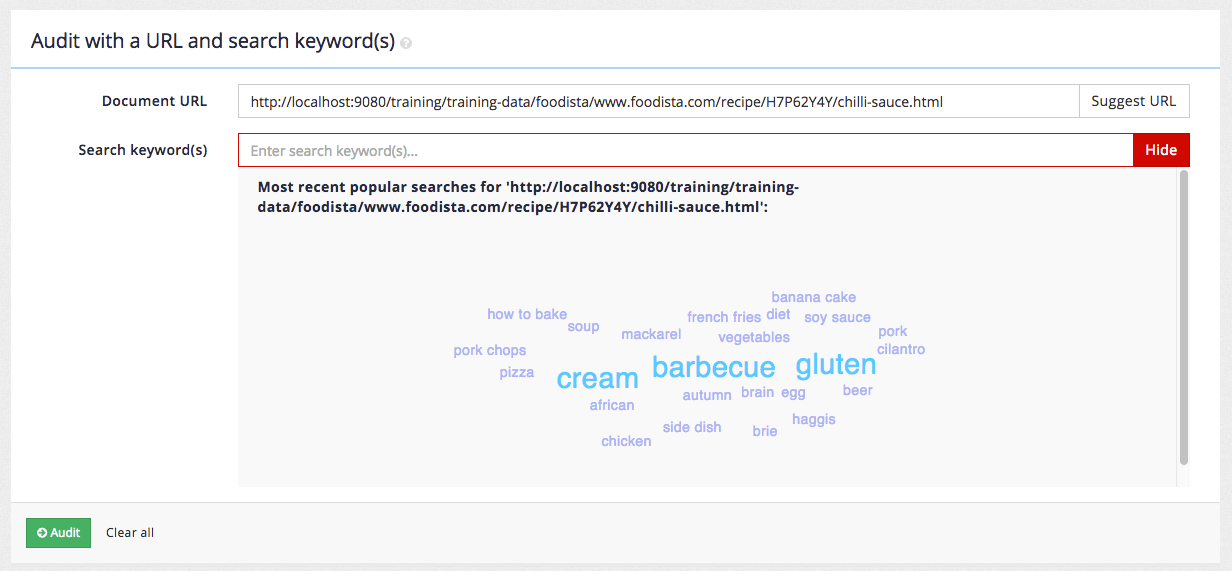
Click on the suggest keyword(s) button to open up a tag cloud of popular search terms for the URL. Clicking on a suggestion will input the keyword into the search keywords field. Note: the suggested keywords for the training dataset are based on fake analytics data and using one of the suggested words has a high chance of returning zero or poor results for the suggested URL.
-
A more common use for SEO auditor case is to answer the question: Why does the URL display at rank X when I search for Y? For this use case the URL and keyword of interest will already be known and should be entered directly into the boxes. Enter the following into the SEO auditor form then press the audit button.
-
Observe that the URL returns at rank number 4 for a query of burger. Looking at the ranking chart it is clear that the content component is the biggest difference between this result and the URL that returned as the first result.
-
Scroll down to the optimization tips for advice on how to potentially improve the ranking of the URL of interest. The suggestions are tailored for the current report. In this case they are focussed on improving the content of the document.
Optimizing your search
Best bets
Best bets allows an administrator to configure a featured result item to be displayed when a user conducts a specific search.
A best bet is not a search result, but it can feature or promote a page / URL that is not part of a website that is being indexed.
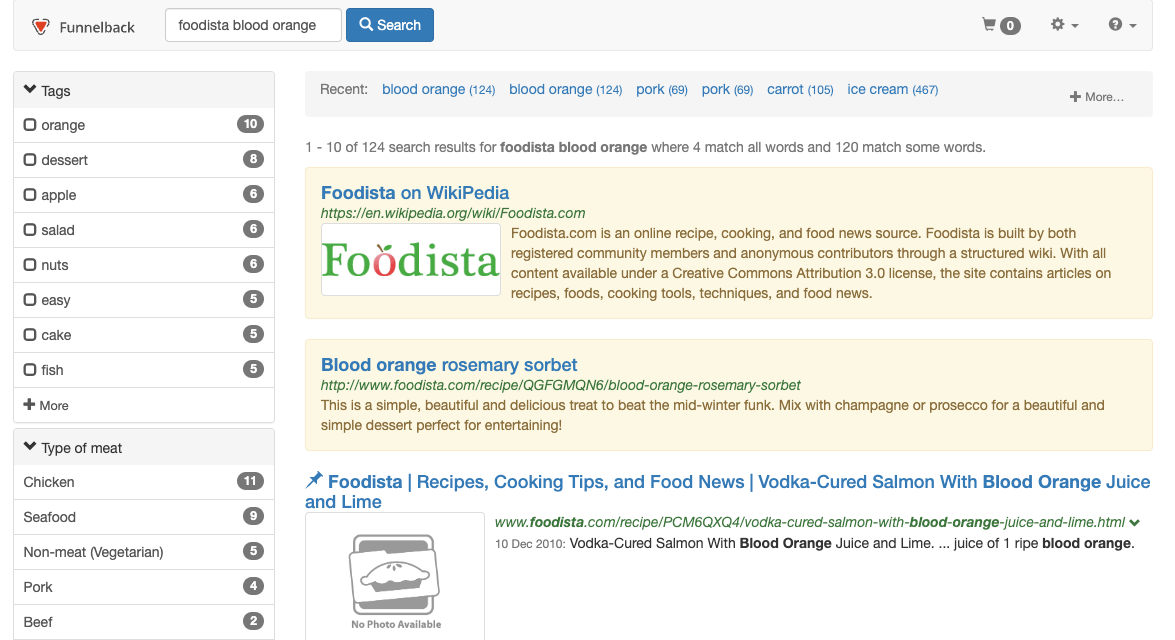
For example, when a user searches for the term Foodista a best bet to featuring the Wikipedia page on Foodista wiki is displayed above the search results. This is presented in addition to the search results.
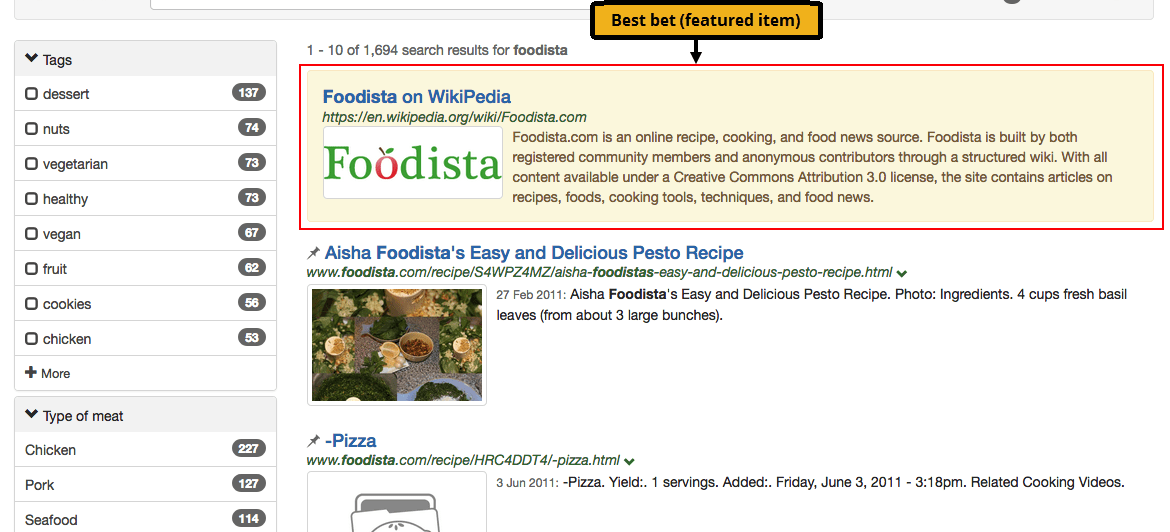
The style and appearance of the best bets in the search results is governed by the stylesheets that are applied to the search results template, and the position in the search results can be controlled by a search administrator with the ability to edit the templates. A best bet can include HTML formatting.
In the example above a HTML snippet including an image of the Foodista logo has been returned with the best bet.
Managing best bets
Best bets are managed from the best bets section of the insights dashboard. The best bets screen provides tools for creation, editing, cloning and deletion of best bets, and also the ability to publish and unpublish.
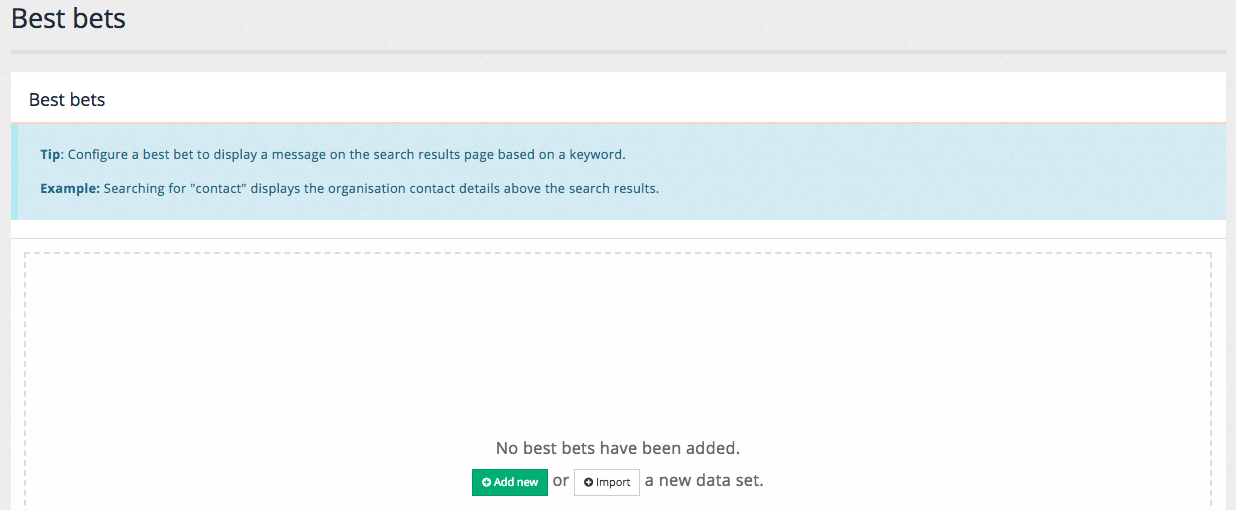
Initial view
If your results page does not have any best bets defined the following screen is displayed when accessing the best bets screen:
Manage view
If your results page has existing best bets defined, a table listing the configured best bets is displayed. Clicking on a best bet opens the best bet inside the editor. Administrators also have the ability to publish, un-publish, clone and delete a best bet:

Cloning an item makes a copy of an existing best bet that can then be edited.
Best bets are not available in the live search until they are published. This allows a best bet to be created and tested before release, or staged for later use.
Clicking the add new button opens the best bet editor.
To remove a best bet it must first be set to an unpublished status by clicking the un-publish button. Once unpublished the best bet can be deleted by clicking on the delete icon.
All best bets can be removed by selecting the menu item.
Creating and editing best bets
Best bets are created, edited and published using a simple edit screen on the administration and insights dashboards.
Best bets edit screen
The example below shows the configuration for a simple best bet.
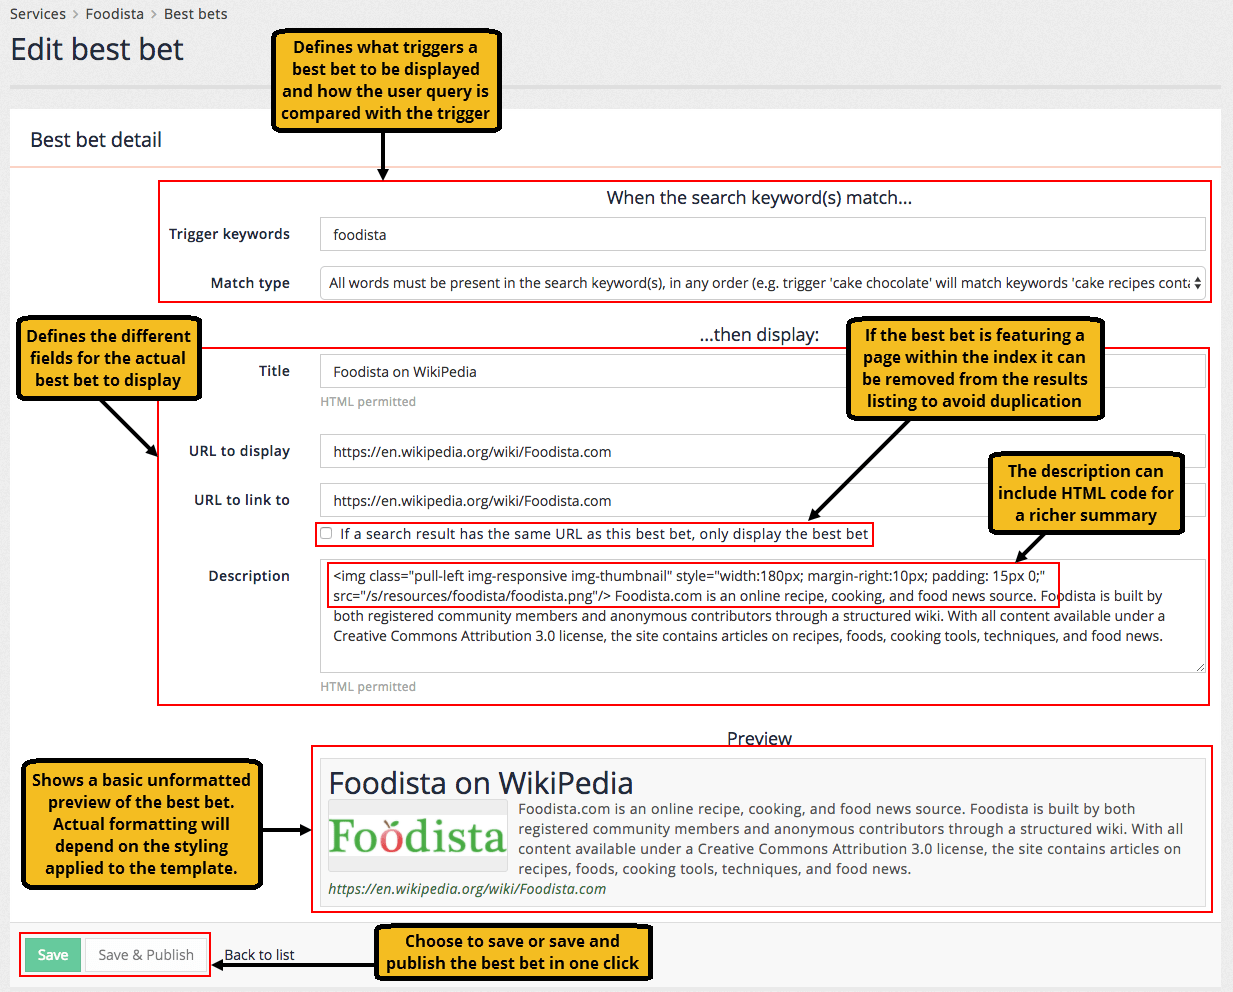
Each best bet requires the following:
- Title
-
used for the hyperlinked text for the best bet result
- Description
-
used for the summary text presented below the title. This can include HTML formatting.
- URL
-
this is the URL to link to when the best bet is clicked on. The URL can be any URL and does not need to be part of the search. There is an option that allows the URL to be removed from the set of search results if it matches the URL for the best bet.
- Trigger
-
these are the search terms that will cause the best bet to be displayed.
- Trigger type
-
this controls how Funnelback compares the user’s query to the best bet trigger. There are four types of triggers:
-
The search keyword(s) exactly matches: This will only trigger if the user’s keyword is identical to the trigger.
-
All words must be present in the search keyword(s), in any order: This is the most commonly used trigger and matches when all the trigger terms appear within the user’s query. For example, the best bet using a trigger of "red wine" will appear as long as the words "red" and "wine" both appear somewhere in the user’s query.
-
Substring match: The best bet is returned if the trigger is a substring of the user’s query. For example, a best bet with a trigger of "red" will be returned for the following queries: red wine, reduction, blackened redfish.
-
Regular expression match: (advanced) The best bet is returned if the trigger regular expression matches the user’s query. This is an advanced match type for power users allowing advanced matching such as wildcards. If you are unfamiliar with regular expressions then don’t use this trigger type. The trigger is expressed as a Perl5 regular expression.
-
| A bulk import/export option is also provided, allowing you to edit all of your best bets inside a CSV file. |
Previewing and publishing a best bet
Funnelback provides the ability to preview changes made to best bets and other configuration allowing changes to be made and viewed without the live search being affected.
The changes are then published to make them visible on the live search.
Best bets once live can also be unpublished - this removes them from the live search and allows them to be previewed and edited for future use.
When an item is saved but marked as unpublished it can be viewed by selecting preview from the menu attached to the search box located at the top of the insights dashboard.

This will run a search using the live index, but apply anything that is marked as unpublished. This allows a best bet to be created and tested before it is released.
Selecting live from the search box menu will run the search against the live index applying only configuration that has been published and is equivalent to what public users of the search will see.
Tutorial: Creating a best bet
-
Log in to the insights dashboard and select the Foodista results page.
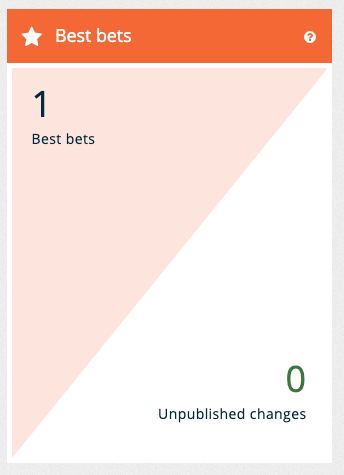
-
Observe the summary tile for best bets. The summary is showing that there is 1 best bet configured - and there are no best bets that contain unpublished changes.
-
Click on the best bets tile, or select best bets from the left hand menu to open the best bets section.

-
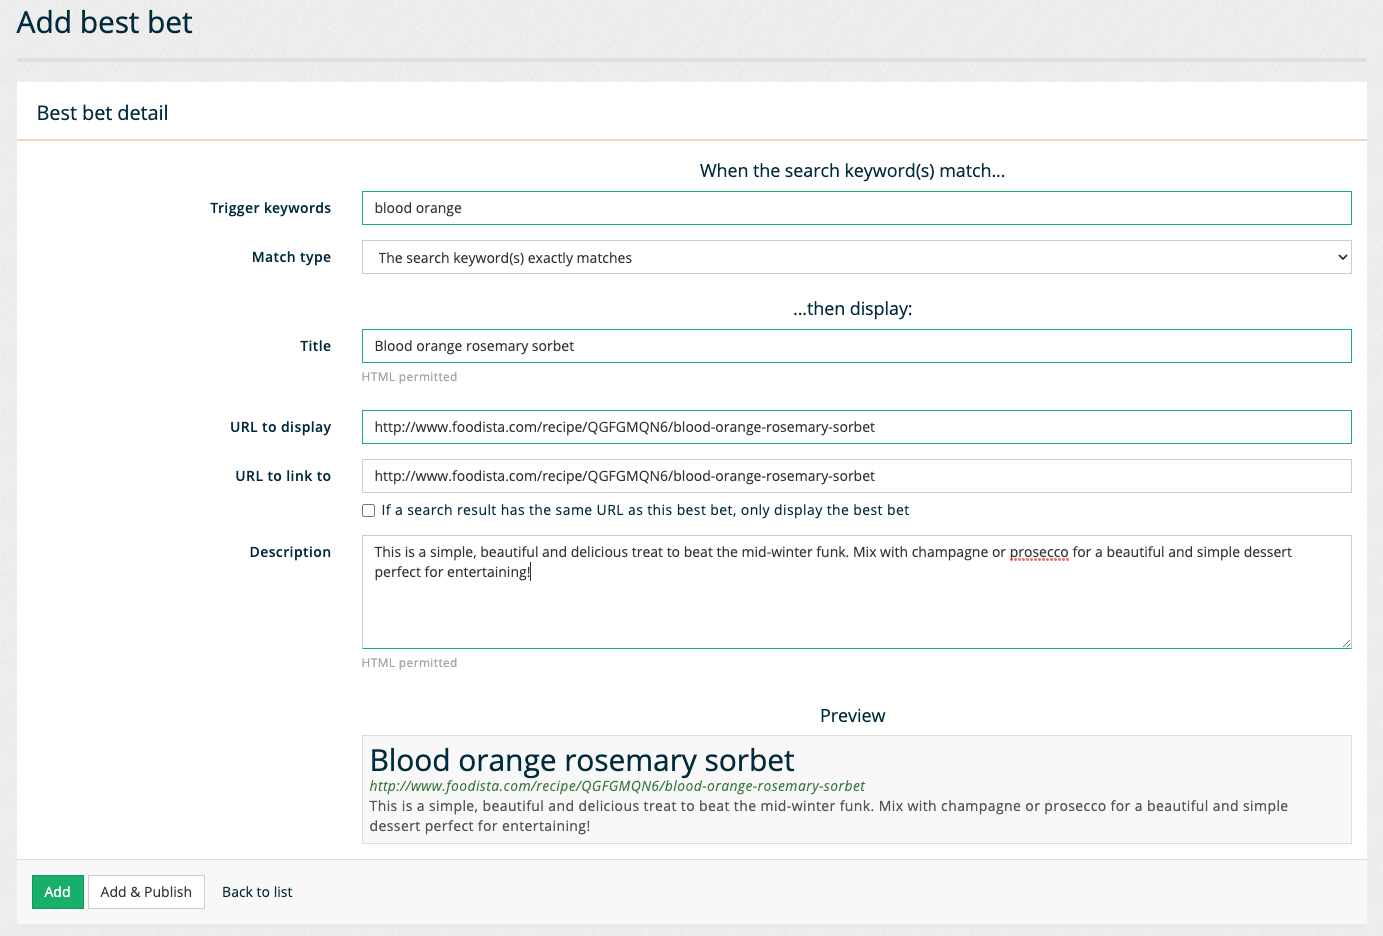
Click the add new button to open the best bets editor. Observe that the preview is updated dynamically as data is entered into the form. Enter the following into the best bets editor then click the add button:
-
Trigger keywords:
blood orange -
Match type: The search keyword(s) exactly matches
-
Title:
Blood orange rosemary sorbet -
URL to display/link to:
http://www.foodista.com/recipe/QGFGMQN6/blood-orange-rosemary-sorbet -
Description:
This is a simple, beautiful and delicious treat to beat the mid-winter funk. Mix with champagne or prosecco for a beautiful and simple dessert perfect for entertaining!
-
-
Observe that the new best bet now appears in the list of best bets, and that it has a status of new and that there is a button available to publish the best bet.

-
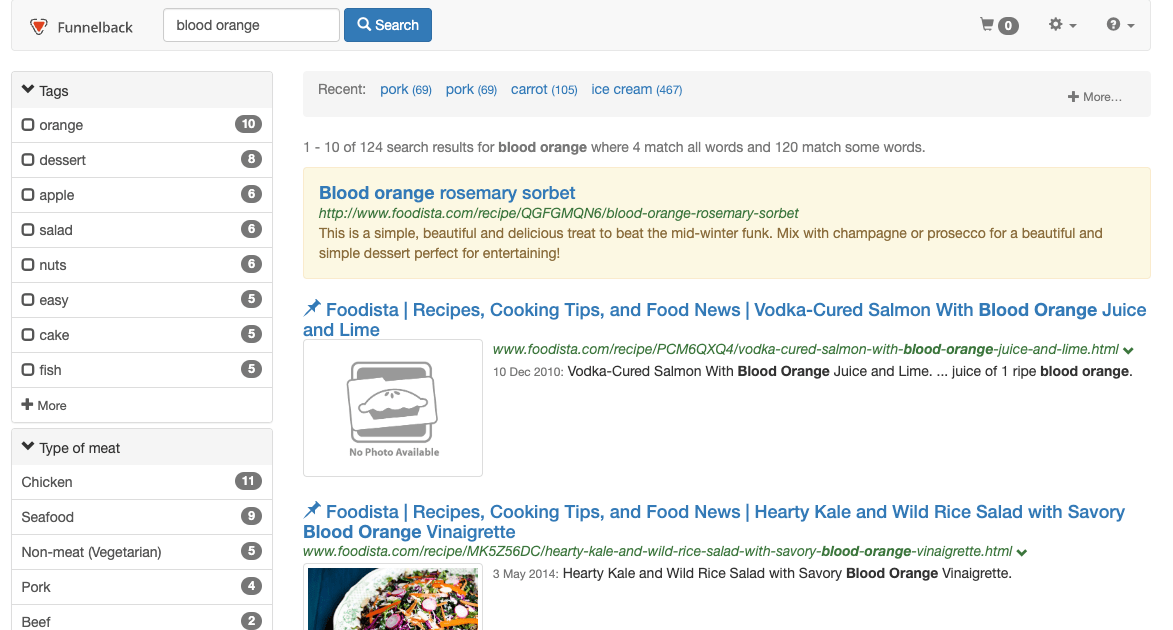
Run a search for blood orange using the search box at the top of the insights dashboard. Ensure that preview is selected from the drop down.

-
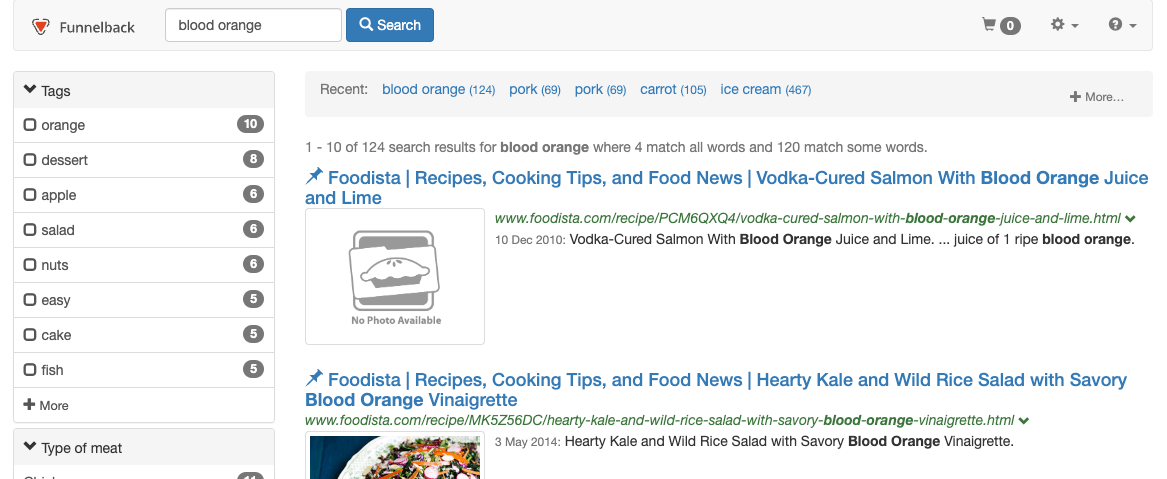
Observe the best bet appearing above the search results. Return to the insights dashboard and run the query again, this time ensuring that live is selected from the drop down.
-
Observe that the same results are returned, but the best bet is not displayed. This is because the best bet has not yet been published. Return to the best bets editor and publish the best bet, then rerun the query ensuring that live is selected from the drop down menu. Observe that the best bet is now returned with the results.
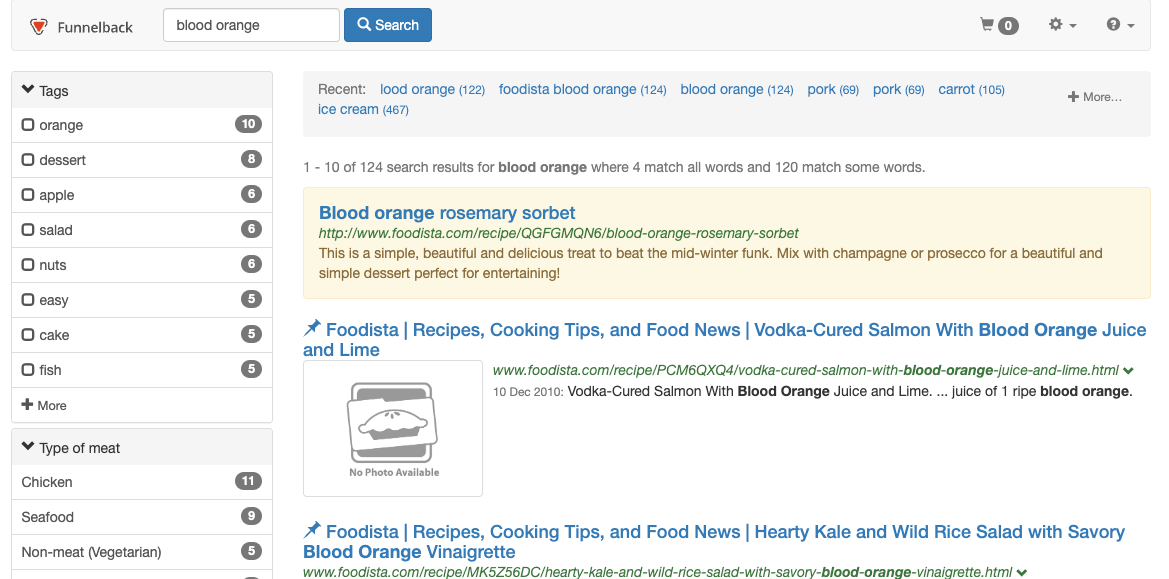
-
Run a search for blood orange juice. Observe that the best bet is not returned. This is because the trigger for the best bet has been set to the search keyword(s) exactly matches - this means that the best bet will only trigger if the user’s query exactly matches blood orange. Return to the best bets editor and change the trigger to substring match. Save and publish the best bet and rerun the search for blood orange juice. Observe that the best bet is returned. This is because the trigger blood orange is a substring of the user’s query, blood orange juice.
-
Return to the best bets editor and change the trigger to foodista orange and the trigger type to all words must be present in the search keyword(s), in any order. Run a search for orange foodista and observe that both best bets are now returned. This is because the trigger conditions for both of the best bets are met. A search for orange cake foodista will also trigger both best bets. This highlights that the order of the trigger terms does not matter when using the all words are present trigger.
Synonyms
A synonym by definition is any word that has the same or nearly the same meaning as another in the same language (for example, lawyer, attorney, solicitor). When compiled together in a database or system of these terms, the result is a thesaurus.
Funnelback supports user-defined synonyms that are configured in a similar manner to best bets.
Funnelback uses the defined synonyms to expand or modify the user’s query terms behind the scenes. This allows an administrator to use synonyms for additional query modification beyond the thesaurus-like definition of a synonym.
Synonyms in Funnelback can be used to:
-
expand a term into a set of equivalent terms. For example, when somebody includes the word lawyer somewhere in a query also search for attorney or solicitor.
-
expand acronyms. For example, if query includes the term moj also search for ministry of justice
-
map user language to internal language, or non-technical language to the equivalent technical terms. Users often don’t know the exact technical words to use and this can prevent them from finding what they are looking for. For example, map bird flu to H1N1.
-
auto-correct known misspellings. For example, if a query includes the word qinwa automatically replace this with quinoa. Funnelback does include a spelling suggestion system, but synonyms can enhance the user experience by fixing a misspelling without a user needing to click on an extra did you mean link.
|
Tutorial: Synonyms
-
Log in to the insights dashboard and select the foodista results page. Open the synonyms editor by selecting synonyms from the left hand menu or by clicking on the synonyms tile.
-
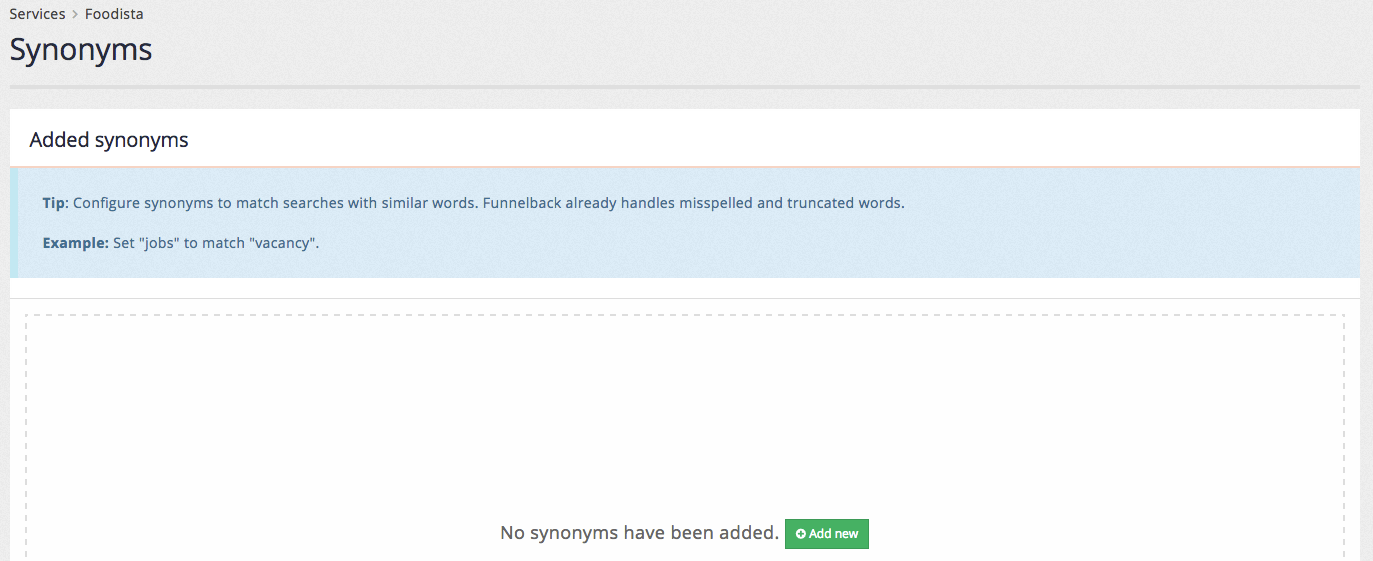
The synonyms listing screen loads and is very similar to the screen used for listing best bets. Create a new synonym by clicking the add new button.
-
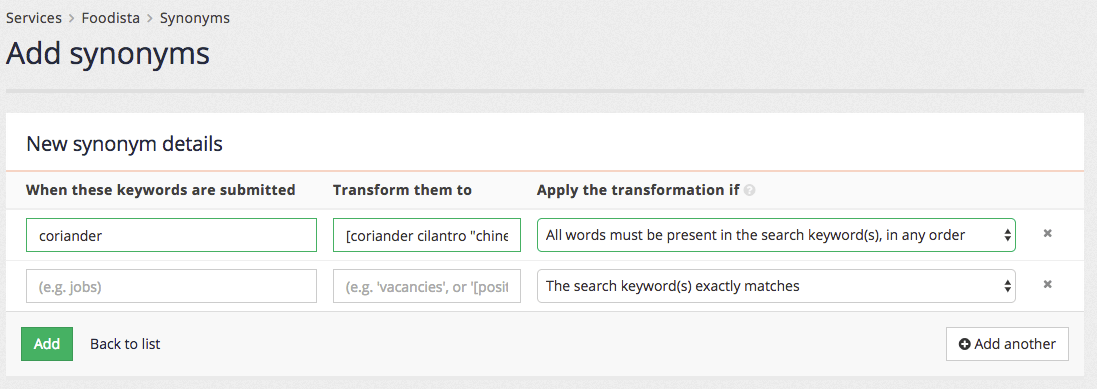
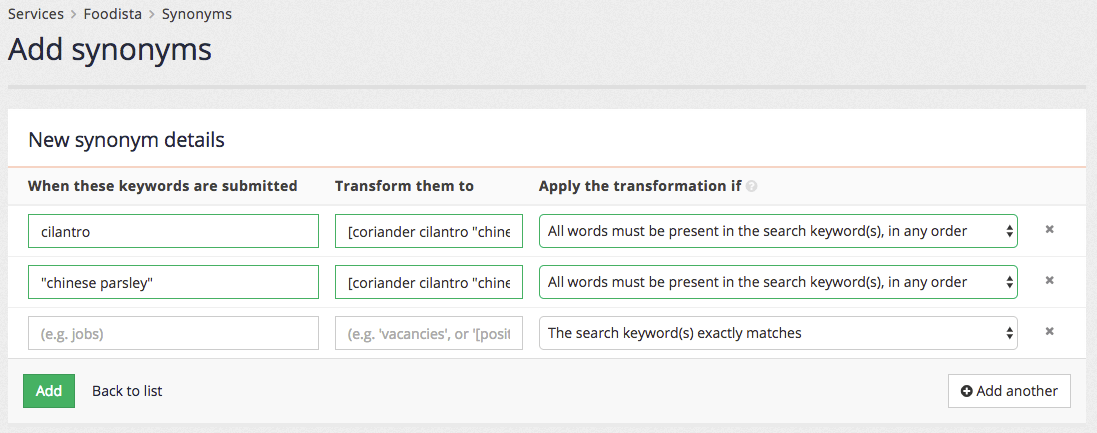
The synonyms editor screen appears allowing the quick entry of multiple synonyms. Create synonyms rules to equate the words coriander, cilantro and chinese parsley. This requires the creation of three rules that expand each of the words into a search for any of the three words. Add a rule with the following:
-
When these keywords are submitted:
coriander -
Transform them to:
[coriander cilantro "chinese parsley"] -
Apply the transformation if: all words must be present in the search keyword(s), in any order
-
-
The first column contains the trigger term (coriander) and is compared with the search query entered by the user. If a match is found (as per the match type in the third column) then the term is transformed to the value in the second column. The square brackets indicate that the terms should be ORed together, and the quotes indicate that the words contained within should be treated as a phrase (so count as a single word).
With this in mind the synonym translates as:
If the word coriander appears anywhere within the user’s query then search for coriander OR cilantro OR "chinese parsley".
So a search for coriander soup would result in a search for (coriander OR cilantro OR "chinese parsley") soup.
Click the add button to add all the synonyms that have been entered on the new synonyms screen.
-
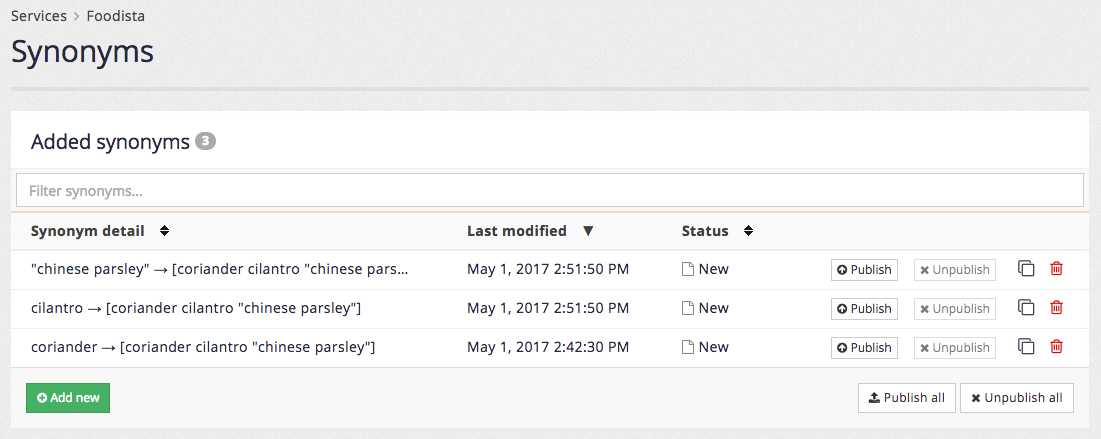
The synonyms listing screen loads showing the defined synonyms:

-
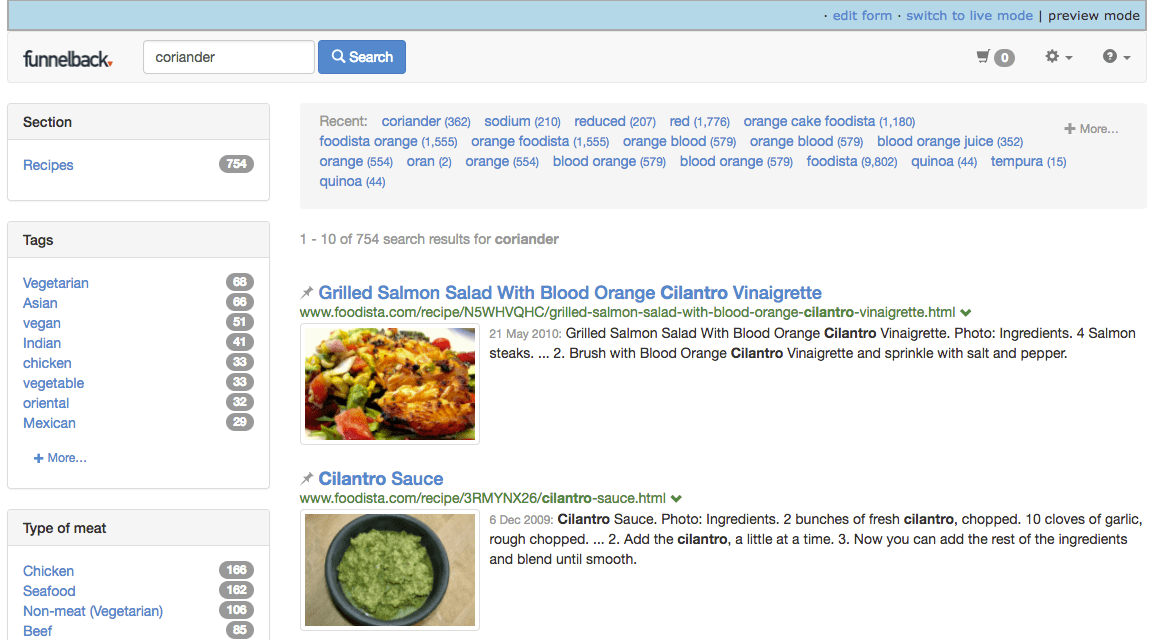
Test the synonym by searching for coriander from the search box at the top of the insights dashboard screen, ensuring the preview option is selected from the drop down menu. Observe that the search results include items for cilantro, and that cilantro is also highlighted in the search results.
-
Create additional synonyms for cilantro and chinese parsley so that searches for any of these terms result in expansion to all three words. Enter both synonyms then click the add button. Don’t forget to set the match type. When entering the chinese parsley trigger enclose this in quotes to ensure that the match is treated as a phrase and only occurs when the word chinese is immediately followed by parsley.
-
The synonyms listing updates to list all three synonyms.
-
Publish all the synonyms by clicking the publish all button.
Curator
Curator allows an administrator to define rules and actions that are applied to a query. Each curator rule sets consist of one or more triggers, and one or more actions to perform.
Curator manage screen
The curator management screen allows an administrator to create, edit, clone, publish and unpublish curator rules.

Curator triggers
Triggers are added on the When the search request match this criteria … tab.
A curator trigger is a set of conditions that when satisfied result in the curator rule running.
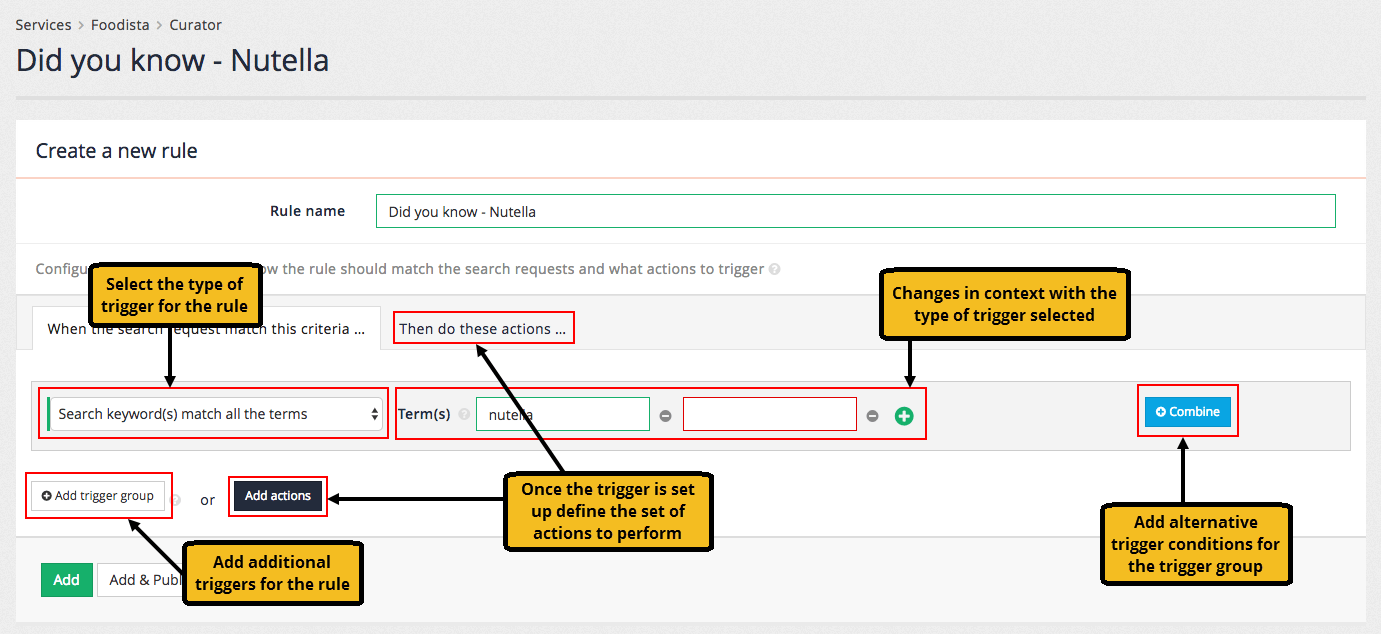
The curator trigger can be made up of a number of different trigger conditions that are combined to form the overall curator trigger.
Each of the curator trigger conditions consist of a trigger type and any additional fields that are required for the type.
Trigger conditions are collected into trigger groups. Each trigger group contains one or more trigger conditions
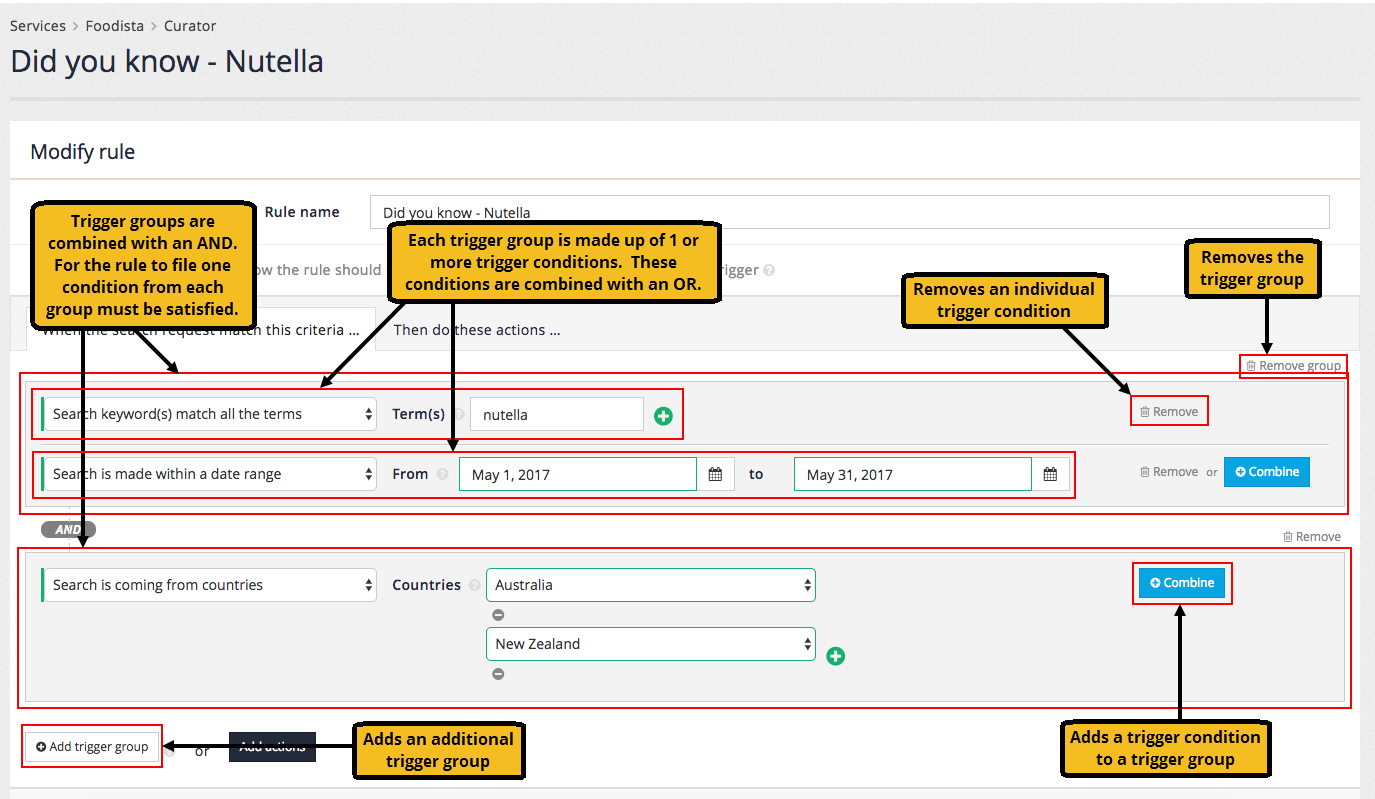
Trigger types
Curator supports a selection of different trigger types that are used for each condition that makes up a trigger group. Additional fields are required for each trigger and vary depending on the chosen trigger type. Most triggers have a positive and negative form (indicated below in the parentheses).
- Facet selection
-
trigger if a specified facet is selected (or not selected)
- Country of origin
-
trigger if a search originates (or does not originate) from a specific set of countries. Country of origin is determined from a reverse IP address lookup on the user’s IP address.
- Date range
-
trigger if the search is made within (or outside of) a specific date period.
- Keyword
-
trigger if the search matches (or does not match) specified keywords. The keywords can be matched to the search as an exact match, substring match, regular expression match or if the search contains all the keywords. The
queryparameter is the default comparison target, but this can be changed with theui.modern.curator.query-parameter-patternresults page option.To create a trigger where the search matches any of the words, create several exact match triggers for your rule (containing the words) and these will be ORed together. - Modify extra search run
-
trigger activates when extra search is enabled with specified ID. It allows modifying extra search run i.e. change of query.
- Number of search results
-
trigger based on a numeric comparison with the number of search results returned. The comparison supports standard numeric comparisons to the number of results (equals, not equals, greater than, greater than or equal to, less than, less than or equal to).
- URL parameters
-
trigger if the search URL contains (or does not contain) specific parameter/value combinations.
- Segment/attribute
-
trigger if the user belongs to (or does not belong to) an industry segment of attribute derived from the user’s IP address.
- Query is empty or not provided
-
trigger if the search is submitted without providing any query terms - this includes null, empty string or a whitespace query.
If you are using this trigger with an older Freemarker template and are displaying a message or advert as an action you may need to update the template code for these to display.
Curator actions
Once you’ve added your rule triggers, define what the rule does by setting up at least one action. Actions are added on the Then do these actions … tab.
The action is executed on search when:
-
curator trigger conditions are fulfilled
-
and the
queryparameter is provided, or the trigger Query is empty or not provided is set.
|
Action types
The curator supports a selection of different action types. Additional fields are required for each action and vary depending on the chosen action type.
- Add to, replace or transform search keywords
-
modifies the user’s query to add, replace or transform terms within the query. Can be used to provide similar behaviour to synonyms but conditionally triggered.
- Add URL parameters
-
allows adding URL parameters to a request before executing search.
You should not add the
queryparameter to your request using this action.If you do add
query, it is added to the search request and will appear in your input parameters field in data model. However, neitherquestion.querynorresponse.queryAsUpdatedfields will be updated and will hold original value, as this parameter is handled specially.Modifications to the
queryparameter should be made using the Add to, replace or transform search keywords curator action.The
collectionparameter cannot be modified and adding this will have no effect. - Disable extra search run
-
allows disabling specified extra search run.
- Display a simple message
-
allows a simple informational message to be returned along with the search results.
- Display an advert
-
allows an item equivalent to a best bet to be returned along with the search results. Custom attributes can also be returned in the data model when this trigger fires.
- Promote results
-
promotes specific URLs to the top of the set of search results. The specified URL for promotion must match the indexed URL (
result.indexUrlin the data model) and will not work with URL modifications made using thealter-live-urlplugin.The promote results action will not work if you have either -daat=0or-service_volume=lowset amongst the query processor options in the results page settings. - Remove results
-
removes specific URLs from the set of search results. The specified URL for removal must match the indexed URL (
result.indexUrlin the data model) and will not work with URL modifications made using thealter-live-urlplugin.The remove results action will not work if you have either -daat=0or-service_volume=lowset amongst the query processor options in the results page settings. - Remove URL parameters
-
allows removing URL parameters from a request before executing search.
- Set sorting options
-
specifies how the search results will be sorted, overriding any other sort configuration.
- Select facet category
-
allows adding URL parameters for facet category before executing search.
- Deselect facet category
-
allows removing URL parameters for facet category before executing search.
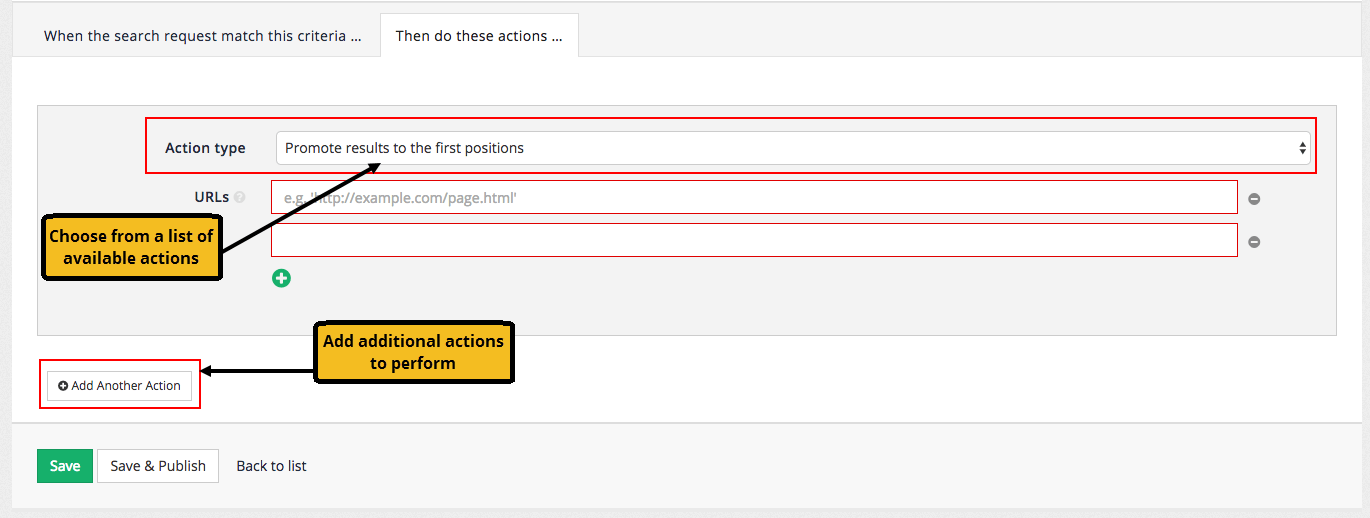
Actions are added and combined in a similar manner to triggers.
Tutorial: Create a simple message curator rule
In this exercise a curator rule will be created to add a simple factual message when a specific keyword is entered.
-
Log in to the insights dashboard, select the Foodista collection then open the curator manager by clicking on curator in the left hand menu, or clicking on the curator tile.
-
Add a new curator rule by clicking the add new button.
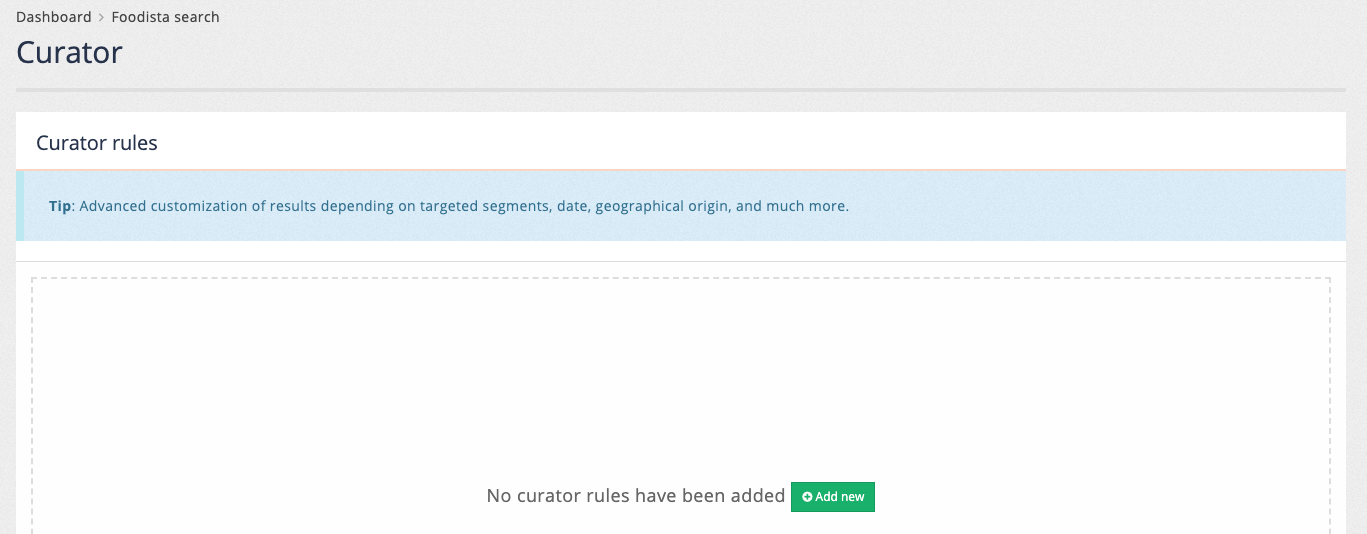
-
The curator rule editor loads. Define a name for the curator rule. The rule name needs to be unique and is used to identify the rule in the curator manager. Observe that the title updates as the rule name is entered.
-
Rule name: Did you know - Nutella
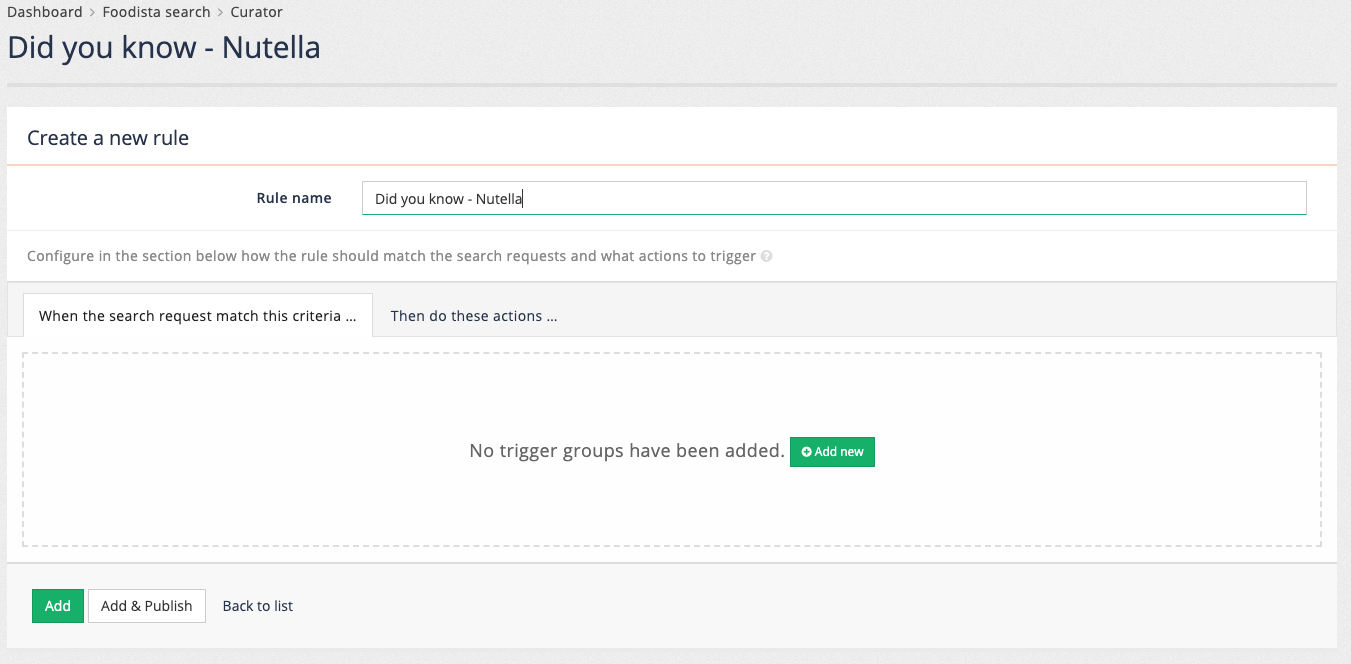
-
-
Create a trigger for the curator rule. The trigger defines the conditions that will cause the rule to run. A rule that will be triggered whenever someone searches for anything about nutella will be defined for this curator rule. Add a trigger group for the curator rule by clicking the add new button. This creates a new trigger group and populates it with a blank rule.

-
Choose the trigger type by clicking on the dropdown menu. Choose search keyword(s) match all the terms as the trigger type.
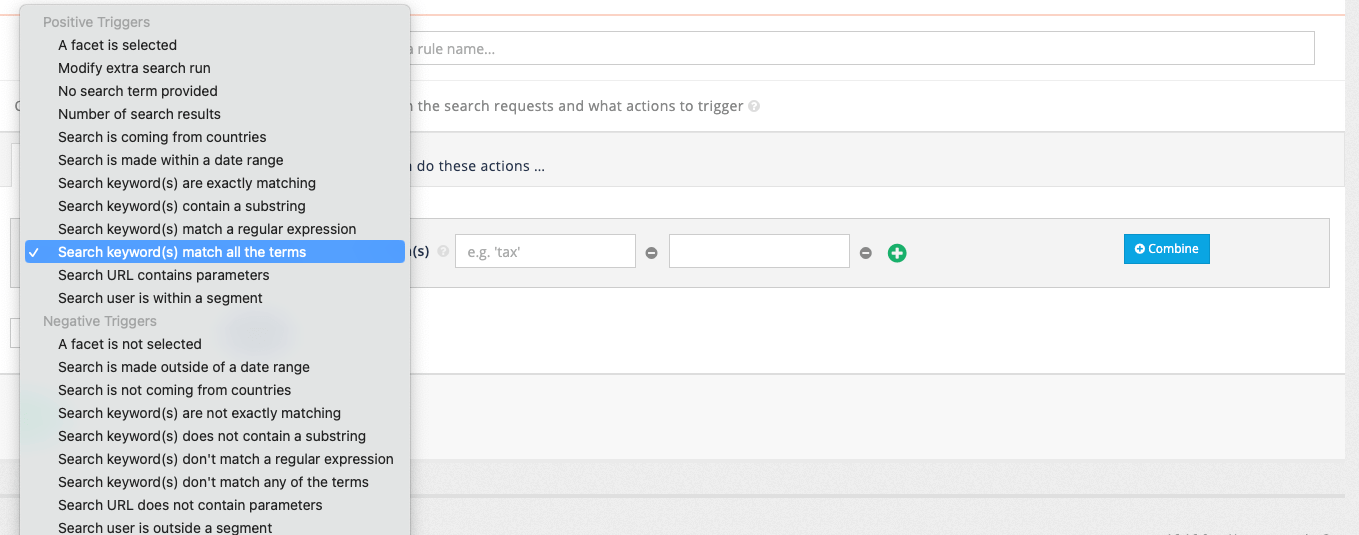
-
Define the additional values required for the trigger type. Enter nutella into one of the term fields. Remove the other empty term field by clicking the adjacent - button.
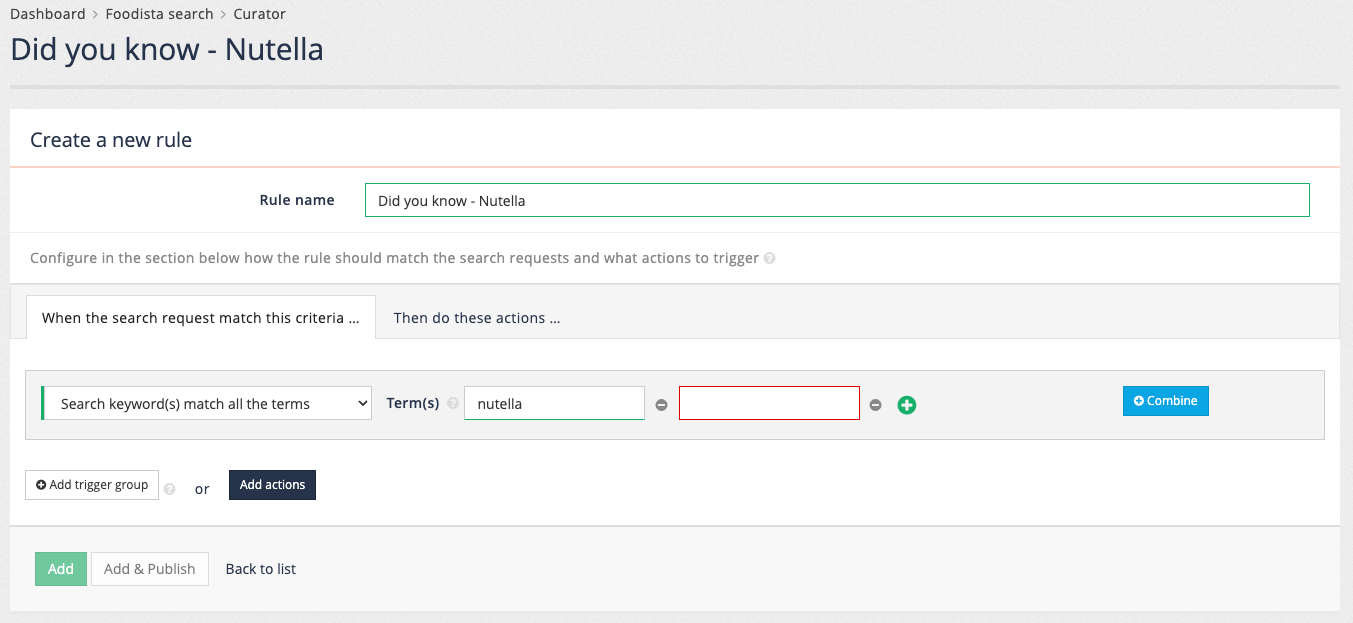
-
This completes the definition for the trigger. Add an action by either clicking on the then do these actions… tab then clicking the add new button, or by clicking the add actions button on the trigger screen.
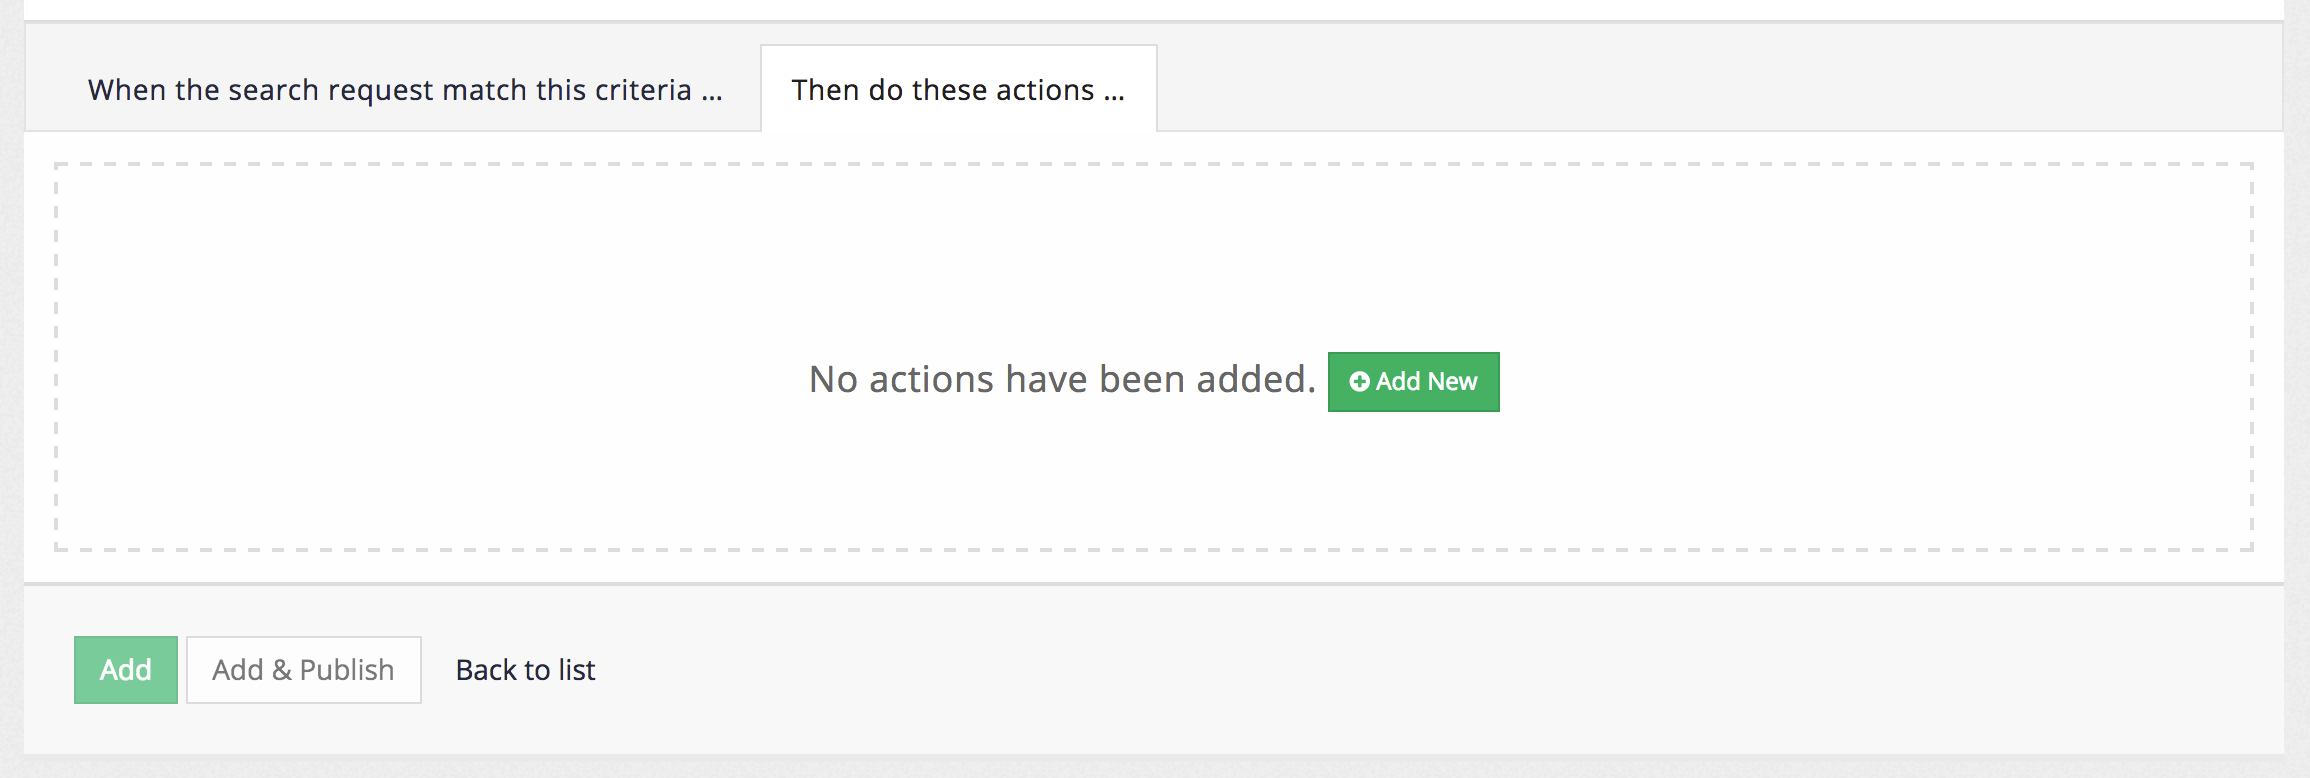
-
Choose an appropriate action type from the action type dropdown menu. Choose:
-
Action: display a simple message.
-
-
Observe that the list of fields updates when the action is changed. The fields for defining an action are dependent on the type of action chosen.

-
Define the additional action fields. Enter the message into the message box.
-
Message: Did you know that February 5 is international Nutella day?
HTML code can be input into this field and observe that a preview is displayed as the message is input. The preview gives a rough idea of how the message may look, but the actual look and feel in the search results page will be governed by the CSS style sheets that the website designer applies.
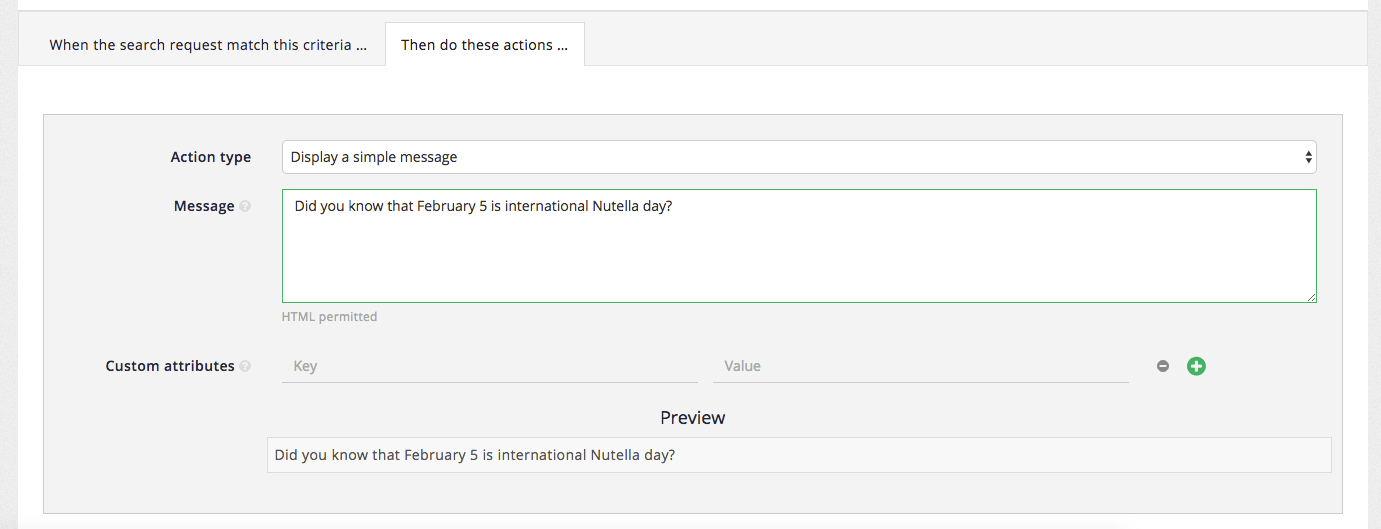
-
-
This completes the definition of the action for this curator rule. Save the rule by clicking the green add button. The curator manager reloads displaying the curator rules that are defined for the service.

-
The curator rule is now saved but unpublished. This means that it can be previewed using the search box at the top of the insights dashboard, by running a search and ensuring that preview is selected. Test the rule by running a search for nutella.

-
Observe that the search results for nutella are displayed and that the message that was just configured is displaying above the search results.
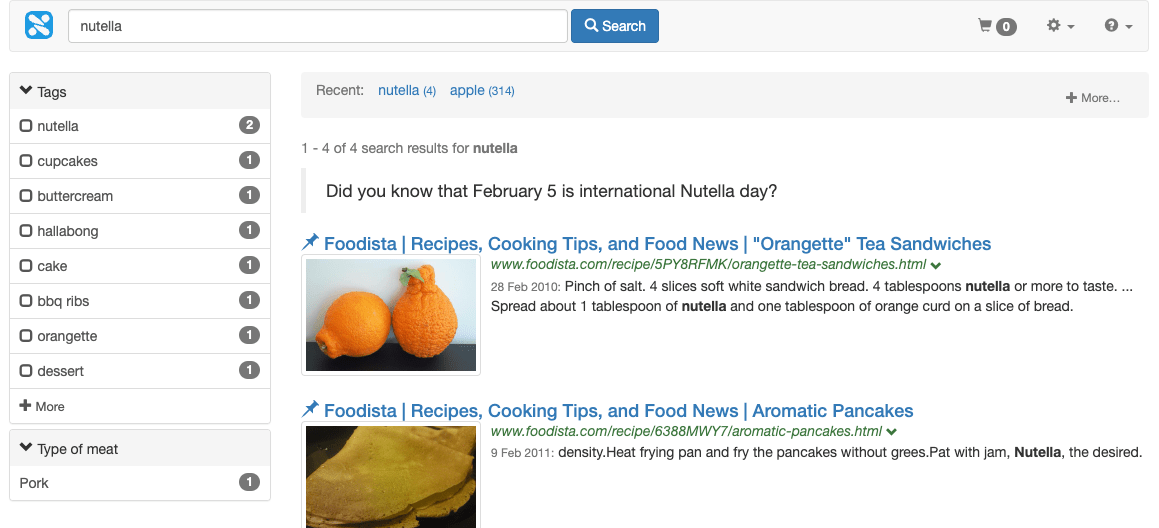
-
Return to the curator manager and edit the curator rule by clicking on the rule name. The editor re-opens allowing modification of the rule.
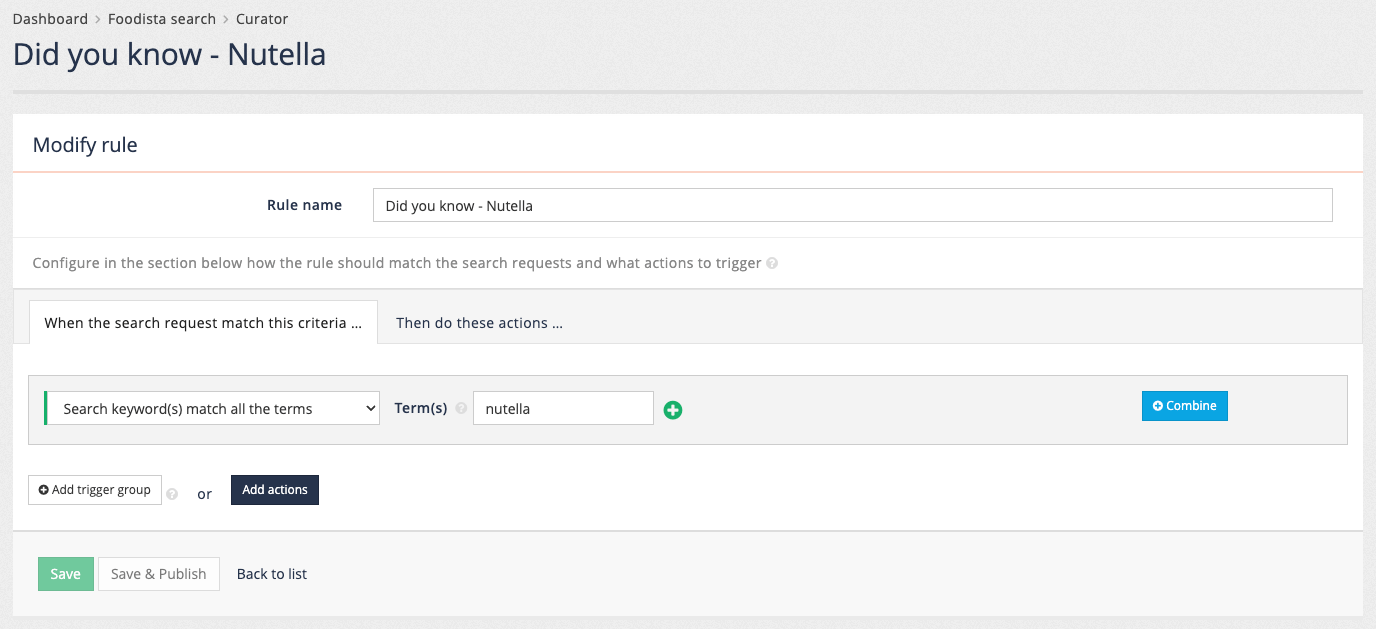
-
Add a second action. Click on the add actions button, or select the then do these actions… tab then click the add another action button. Observe that an empty action is added below the first action.
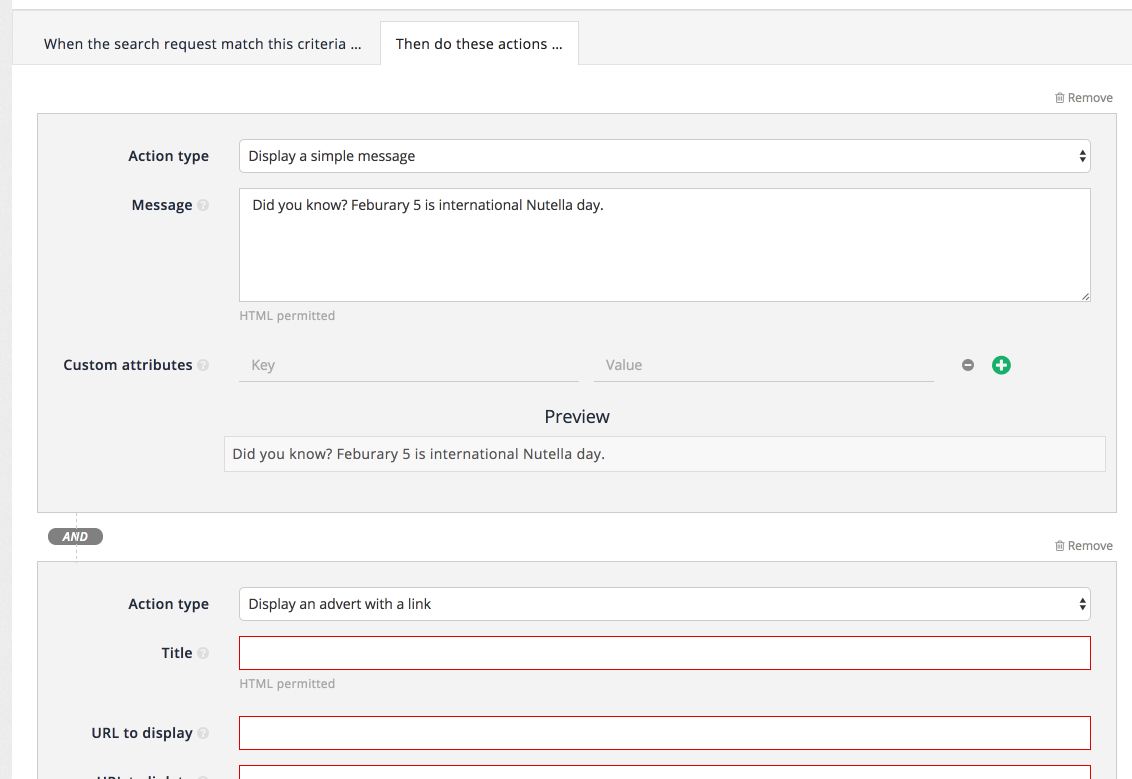
-
Change the action type of the new action to add terms to the search keywords, and enter cake into the terms field. Save the action then re-run the search for nutella.

-
Observe that there are now more results returned, and these are made up of fully matching and partially matching results. The fully matching results include both words and partially matching results include either of the words. Also observe that the word cake is highlighted in the result summaries and that the message is still being displayed. This demonstrates a curator rule that has two actions for a single trigger.
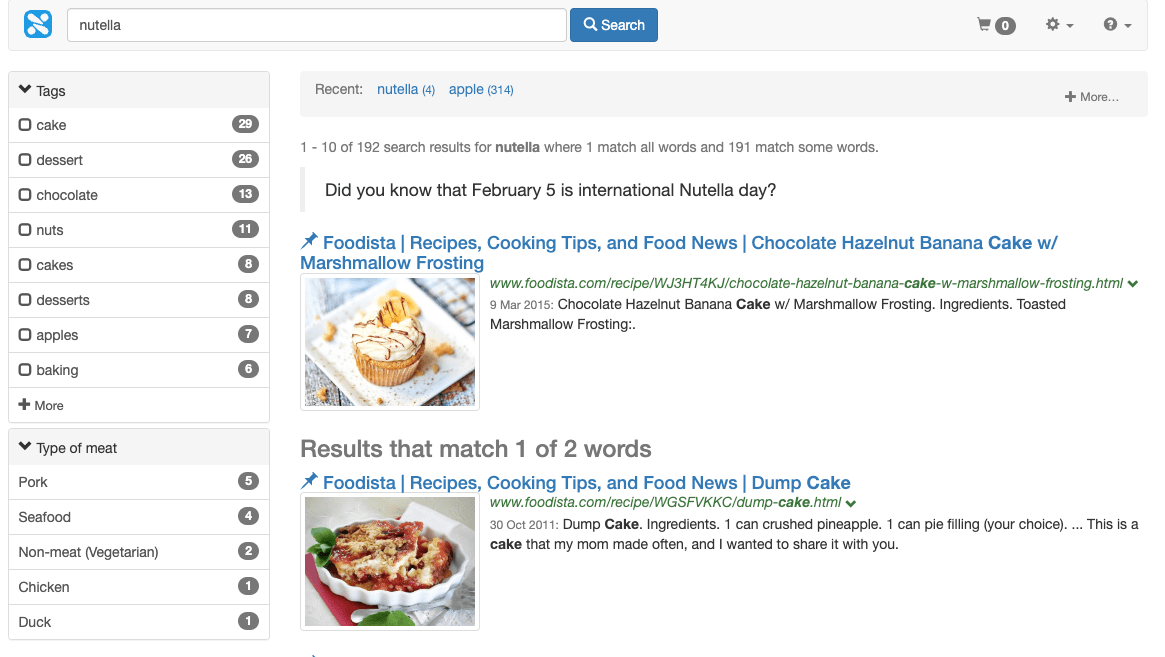
-
You can also combine multiple triggers with ANDs and ORs. For example you may want the International Nutella Day message to be displayed on the actual date, February 5th.
-
To do so, return to the curator manager and edit the rule.
-
You may want the rule to trigger when the query "nutella" is entered AND the date is February 5th. To do so, click on add a trigger group. This will combine triggers with AND. To combine triggers with OR, use the Combine button.
-
Select the Search is made within a date range trigger type and select the 5th of February for the current year.

-
Save the rule and run the search again. The message should not be displayed anymore. You can edit the rule again, change the date today’s date, save, and confirm the rule is displayed again.
-
Return to the curator manager and publish the curator rule to make it live.
Tuning your search
Tuning is a process that can be used to determine which attributes of a document are indicative of relevance and adjust the ranking algorithm to match these attributes.
The default settings in Funnelback are designed to provide relevant results for the majority of websites. Funnelback uses a ranking algorithm, influenced by many weighted factors, that scores each document in the index when a search is run. These individual weightings can be adjusted and tuning is the recommended way to achieve this.
The actual attributes that inform relevance will vary from site to site and can depend on the way in which the content is written and structured on the website, how often content is updated and even the technologies used to deliver the website.
For example the following are examples of concepts that can inform on relevance:
-
How many times the search keywords appear within the document content
-
If the keywords appear in the URL
-
If the keywords appear in the page title, or headings
-
How large the document is
-
How recently the document has been updated
-
How deep the document is within the website’s structure
Tuning allows for the automatic detection of attributes that influence ranking in the data that is being tuned. The tuning process requires training data from the content owners. This training data is made up of a list of possible searches - keywords with what is deemed to be the URL of the best answer for the keyword, as determined by the content owners.
A training set of 50-100 queries is a good size for most search implementations. Too few queries will not provide adequate broad coverage and skew the optimal ranking settings suggested by tuning. Too many queries will place considerable load on the server for a sustained length of time as the tuning tool runs each query with different combinations of ranking settings. It is not uncommon to run in excess of 1 million queries when running tuning.
Funnelback uses this list of searches to optimize the ranking algorithm, by running each of the searches with different combinations of ranking settings and analysing the results for the settings that provide the closest match to the training data.
| Tuning does not guarantee that any of the searches provided in the training data will return as the top result. It’s purpose is to optimize the algorithm by detecting important traits found within the content, which should result in improved results for all searches. |
The tuning tool consists of two components - the training data editor and the components to run tuning.
Any user with access to the insights dashboard has the ability to edit the tuning data.
Only an administrator can run tuning and apply the optimal settings to a search.
| The running of tuning is restricted to administrators as the tuning process can place a heavy load on the server and the running of tuning needs to be managed. |
Editing training data for tuning
The training data editor is accessed from the insights dashboard by clicking on the tuning tile, or by selecting tuning from the left hand menu.
A blank training data editor is displayed if tuning has not previously been configured.
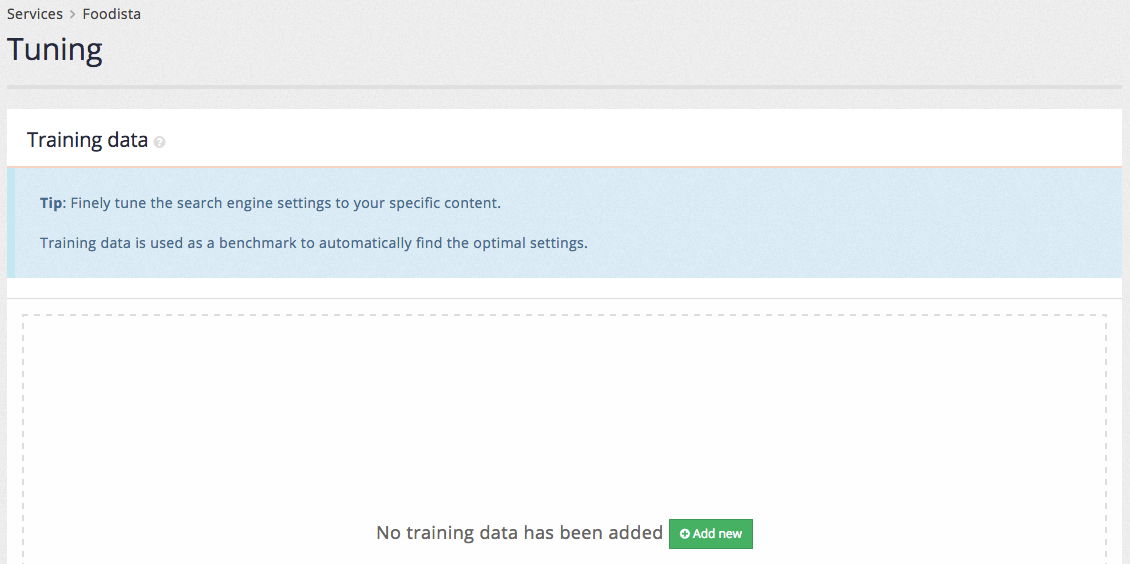
Clicking the add new button opens the editor screen.
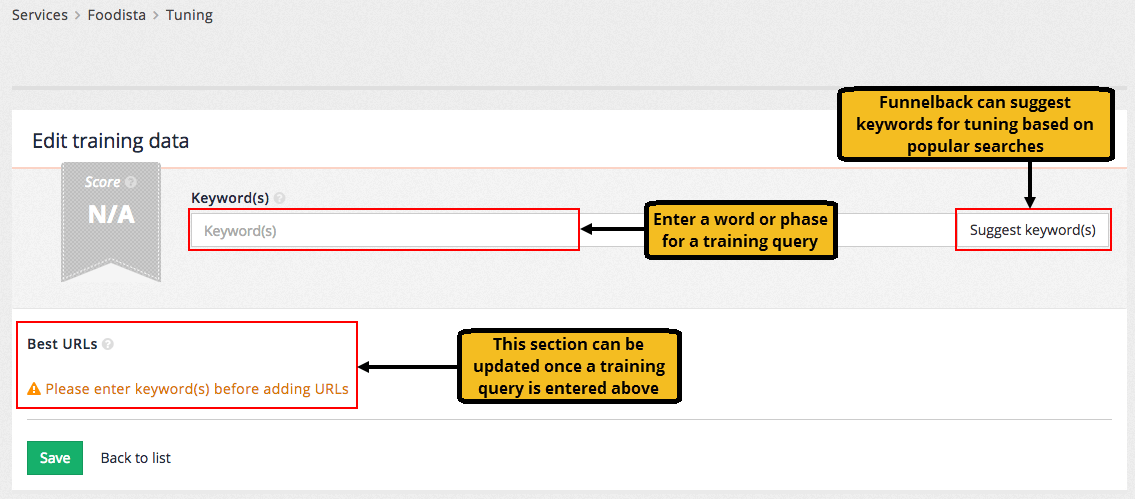
The tuning requires 50-100 examples of desirable searches. Each desirable search requires the search query and one or more URLs that represent the best answer for the query.
Two methods are available for specifying the query:
-
Enter the query directly into the keyword(s) field, or
-
Click the suggest keyword(s) button the click on one of the suggestions that appear in a panel below the keyword(s) form field. The suggestions are randomised based on popular queries in the analytics. Clicking the button multiple times will generate different lists of suggestions.

Once a query has been input the URLs of the best answer(s) can be specified.
URLs for the best answers are added by either clicking the suggest URL to add or manually add a URL buttons.
Clicking the suggest URLs to add button opens a panel of the top results (based on current rankings).
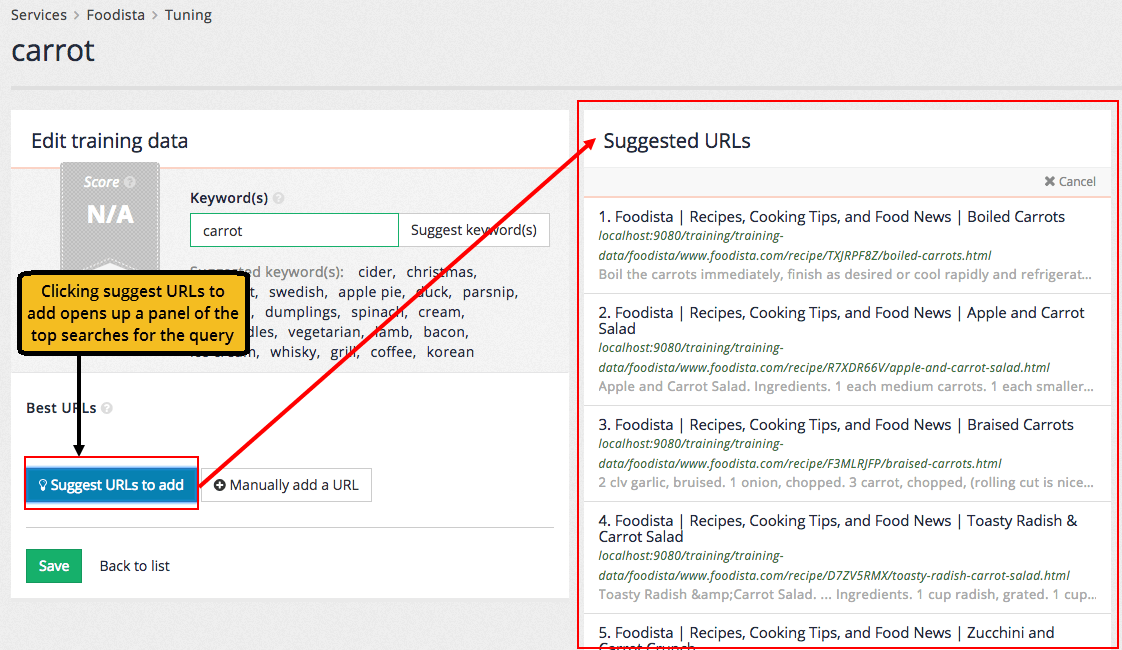
Clicking on a suggested URL adds the URL as a best answer.
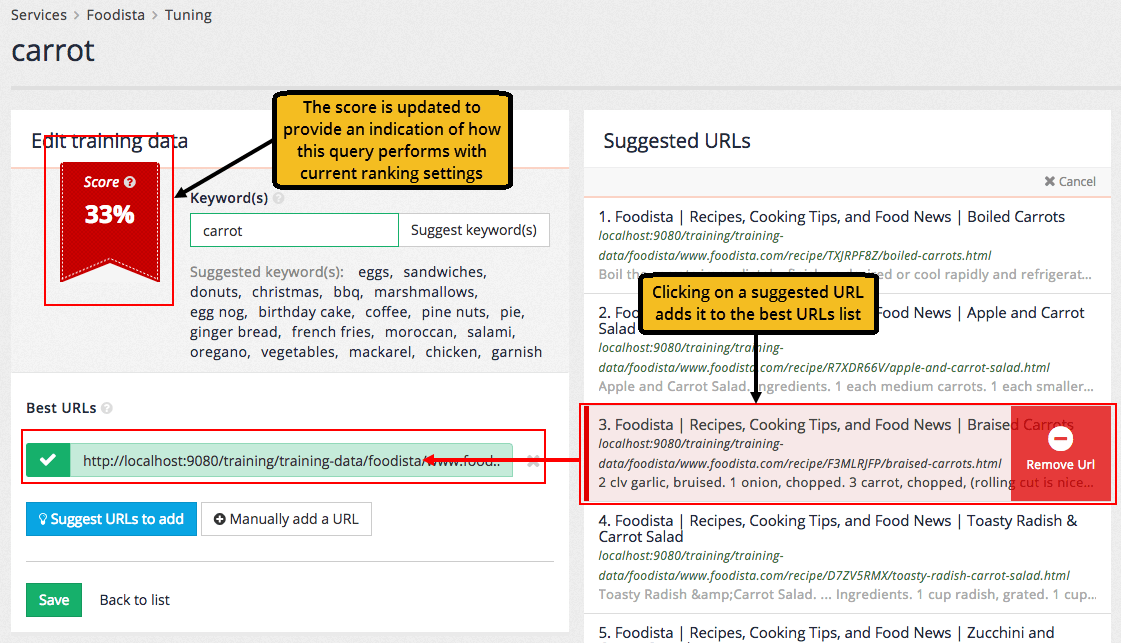
Additional URLs can be optionally added to the best URLs list - however the focus should be on providing additional query/best URL combinations over a single query with multiple best URLs.
A manual URL can be entered by clicking the manually add a URL button. Manually added URLs are checked as they are entered.
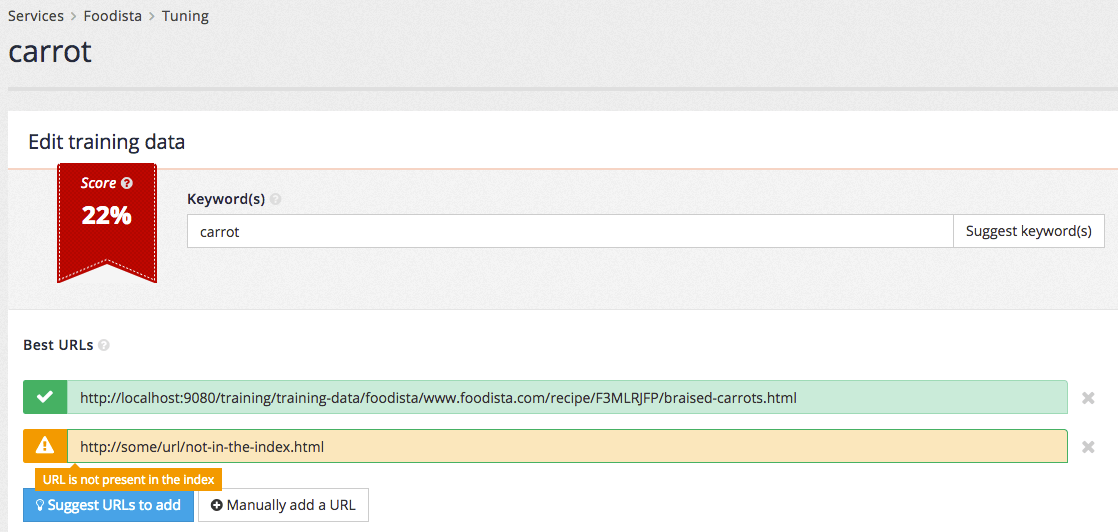
Clicking the save button adds the query to the training data. The tuning screen updates to show the available training data. Hovering over the error status icon shows that there is an invalid URL (the URL that was manually added above is not present in the search index).
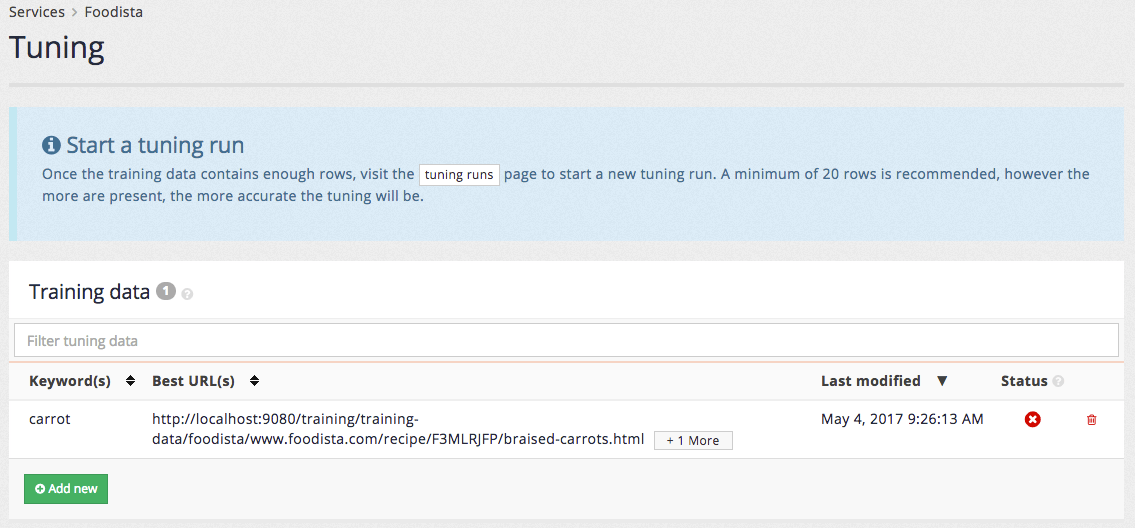
Once all the training data has been added tuning can be run.
Tuning is run from the tuning history page. This is accessed by clicking the history sub-item in the menu, or by clicking the tuning runs button that appears in the start a tuning run message.
The tuning history shows the previous tuning history for the service and also allows users with sufficient permissions to start the tuning process.
| Recall that only certain users are granted the permissions required to run tuning. |
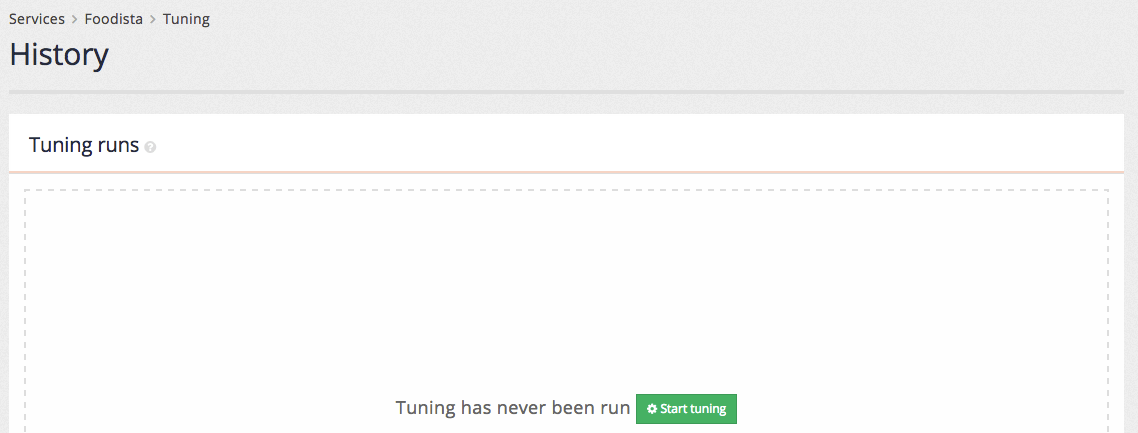
Clicking the start tuning button initiates the tuning run and the history table provides updates on the possible improvement found during the process. These numbers will change as more combinations of ranking settings are tested.

When the tuning run completes a score over time graph will be updated and the tuning runs table will hold the final values for the tuning run.
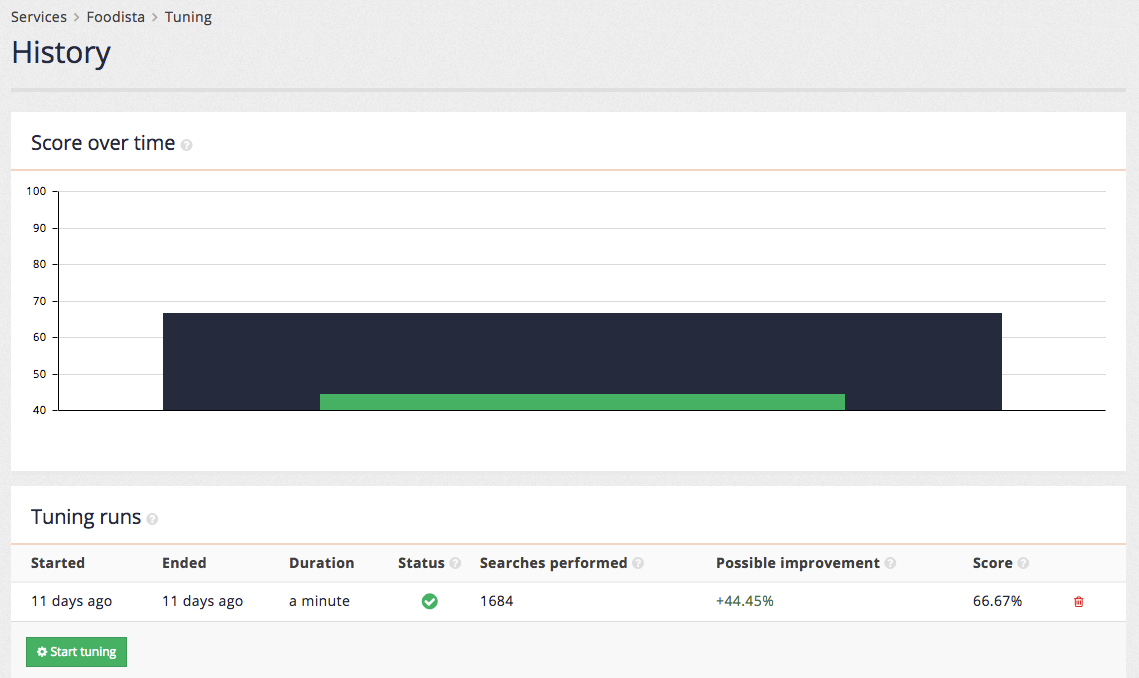
Once tuning has been run a few times additional data is added to both the score over time chart and tuning runs table.
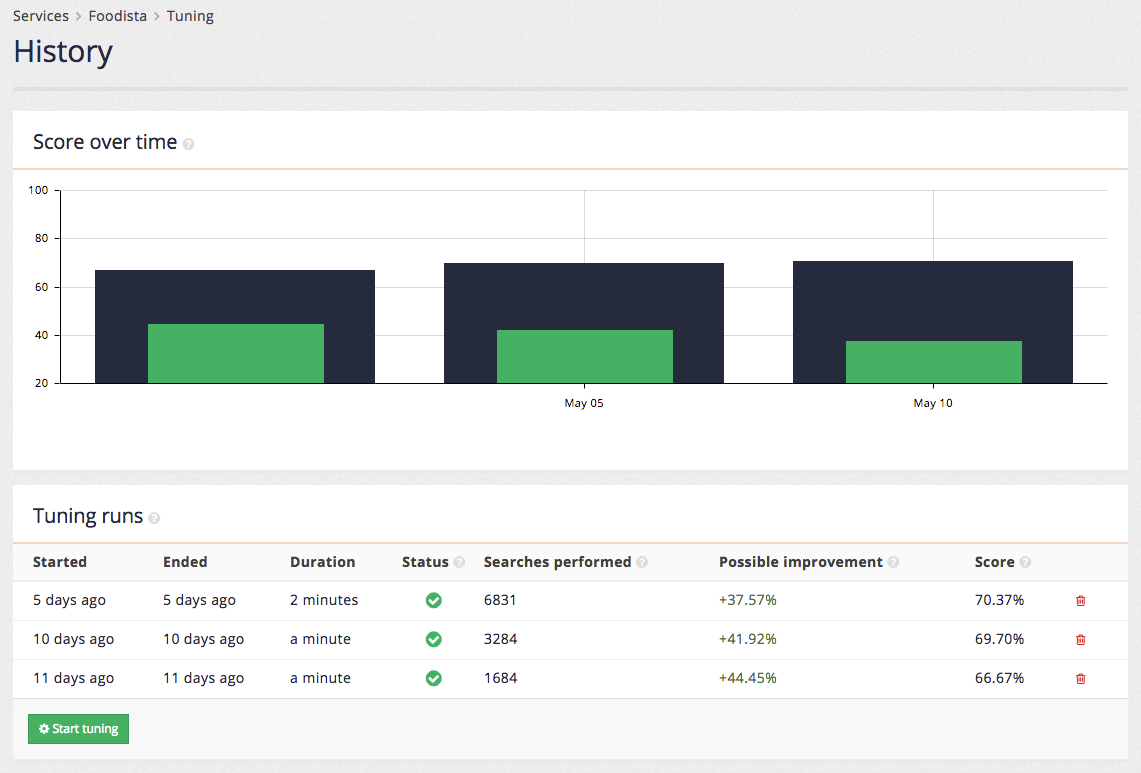
The tuning tile on the insights dashboard main page also updates to provide information on the most recent tuning run.
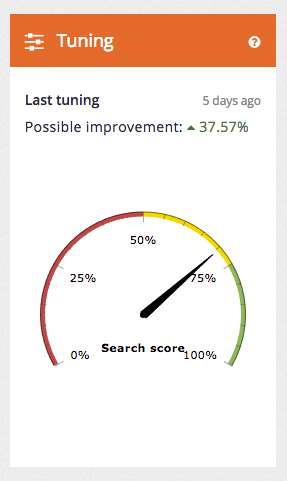
| The improved ranking is not automatically applied to the search. An administrator must log in to apply the optimal settings as found by the tuning process. |
Tutorial: Edit tuning data
-
Access the insights dashboard and select the foodista search results page tile. Select tuning from the left hand menu, or click on the tuning tile.
-
Alternatively, from the search dashboard open the foodista search results page management screen, and access the tuning section by selecting edit tuning data from the tuning panel.
-
The insights dashboard tuning screen opens. Click on the add new button to open up the tuning editor screen.
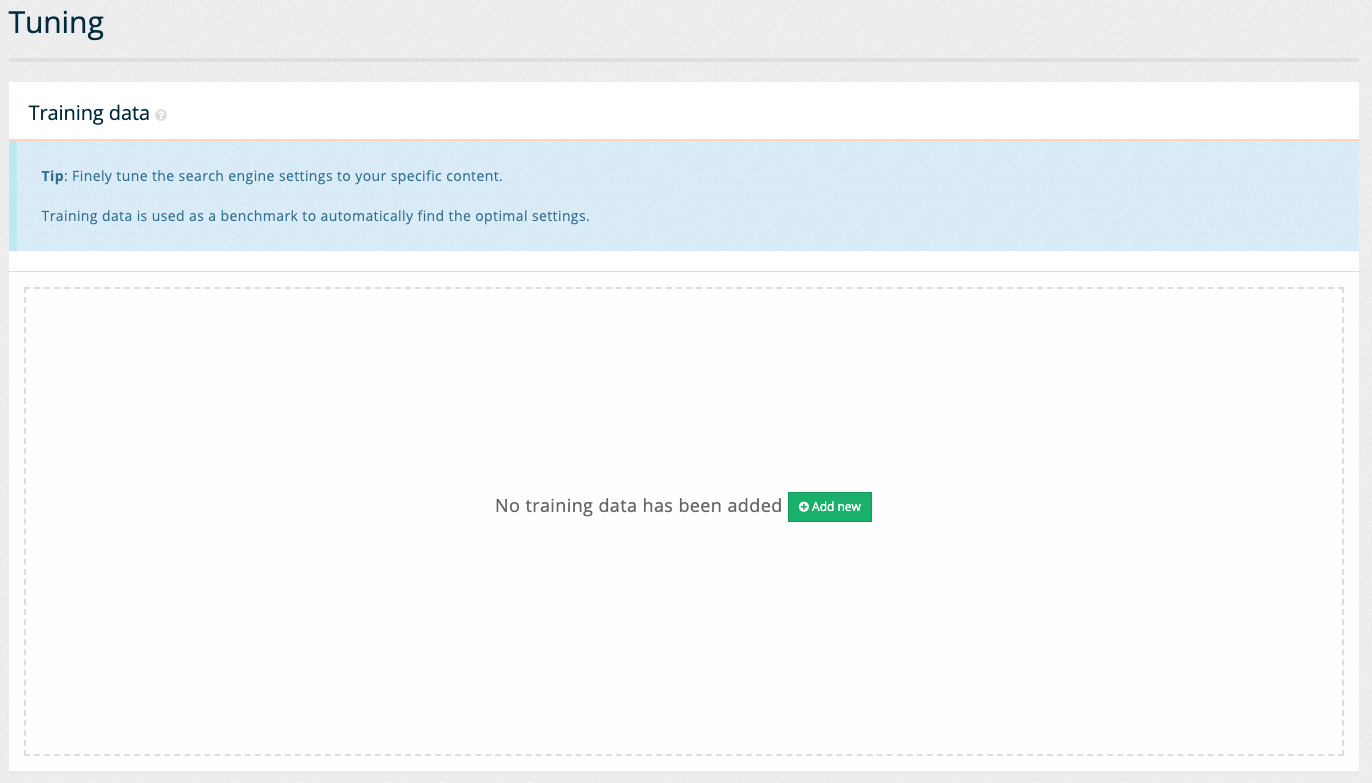
-
An empty edit screen loads where you can start defining the training data. Enter a query by adding a word or phrase to the keyword(s) field. Edit the value in the keyword(s) field and enter the word
carrot.You can also use the suggest keyword(s) button to receive a list of keywords that you can choose from. 
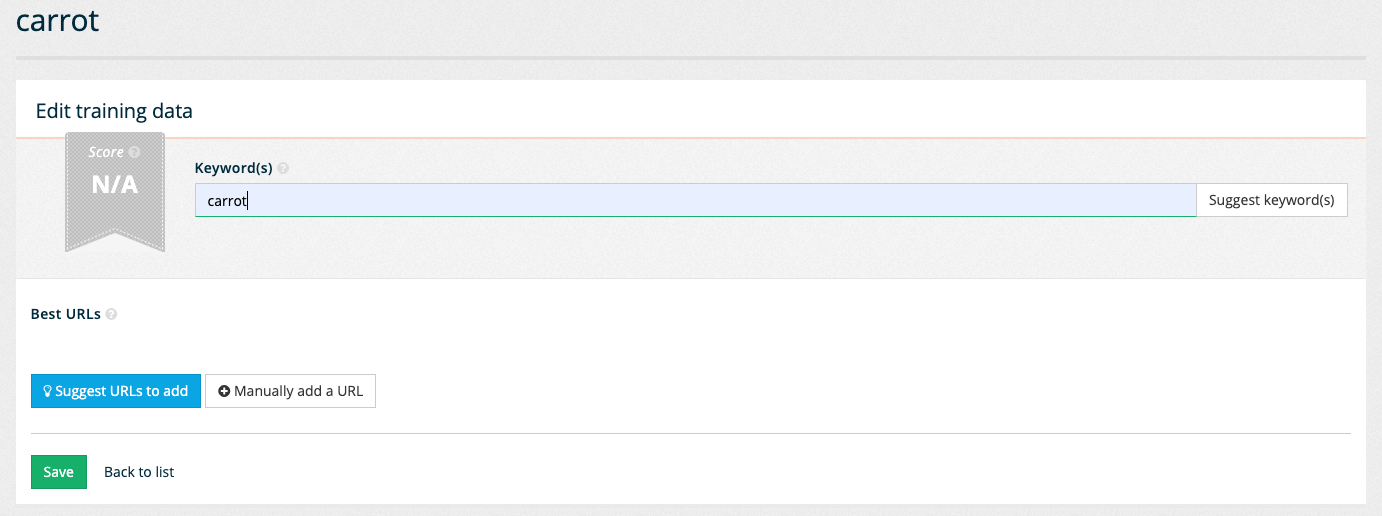
-
Observe that the best URLs panel updates with two buttons allowing the best answers to be defined. Click on the suggest URLs to add button to open a list containing of pages to choose from. Select the page that provides the best answer for a query of carrot. Note that scrolling to the bottom of the suggested URLs allows further suggestions to be loaded. Click on one of the suggested URLs, such as the light carrot and raisin muffins at rank 5, to set it as the best answer for the search. Observe that the selected URL appears beneath the Best URLs heading.
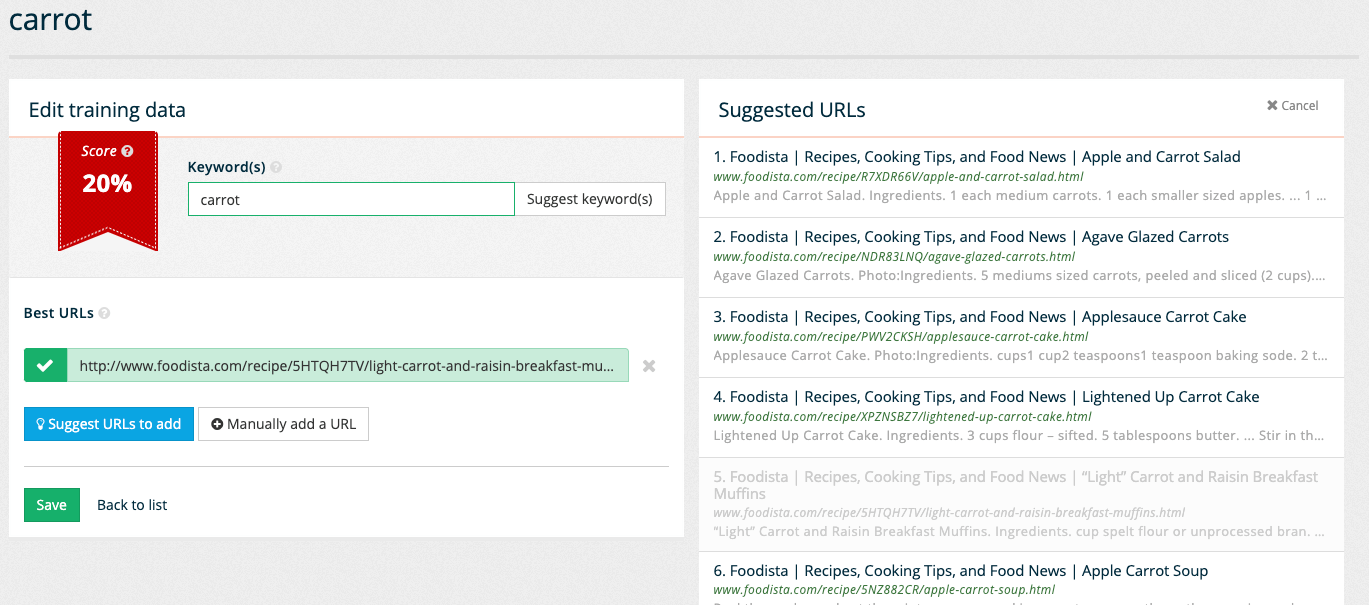
-
Save the sample search by clicking on the save button. The training data overview screen reloads showing the suggestion that was just saved.

-
Run tuning by switching to the history screen. The history screen is accessed by selecting history from the left hand menu, or by clicking on the tuning runs button contained within the information message at the top of the screen.
-
The history screen is empty because tuning has not been run on this results page. Start the tuning by clicking the start tuning button. The screen refreshes with a table showing the update status. The table shows the number of searches performed and possible improvement (and current score) for the optimal set of raking settings (based on the combinations that have been tried so far during this tuning run.

-
When the tuning run completes the display updates with a score over time chart that shows the current (in green) and optimized scores (in blue) over time.
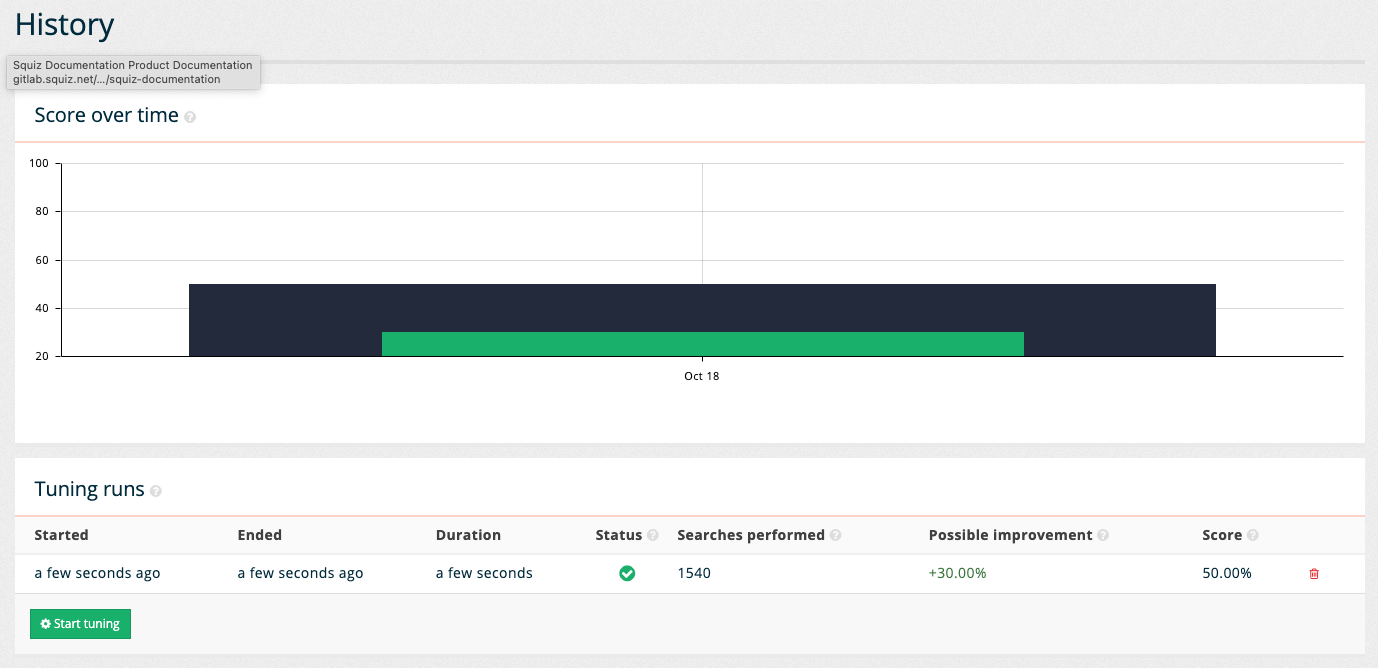
-
Open the insights dashboard screen by clicking the Foodista dashboard item in the left hand menu and observe the tuning tile shows the current performance.
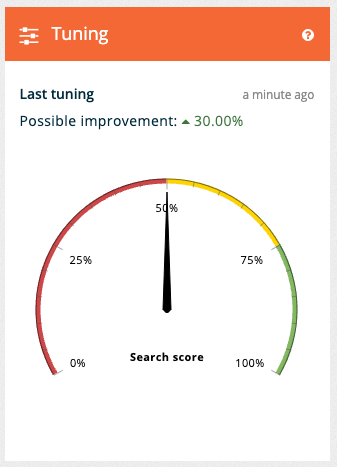
Tips and tricks
Using your analytics to improve your search
Search analytics provides an insight into what your users are actually looking for as it presents the words and phrases that your users have entered into a search box.
The search experience can be greatly enhanced by applying a few simple techniques in combination with regular analysis of the analytics reports.
Top searches
Funnelback’s top searches report shows you the most popular searches, ranked by popularity.
This provides a window into the information that users are seeking and helps an administrator understand the website audience.
Better still, this information allows prioritization to be given to content creation and maintenance.
Top unanswered searches
Funnelback’s top unanswered searches report shows the most frequent searches that did not return any fully matching results.
This is a very useful report as it helps to identify:
-
Language differences: users searching for language that differs from that used on the website.
-
Content that is not present: users searching for content that simply does not exist on the website.
-
Common misspellings: users can have terrible spelling, and mobile internet usage has made this worse.
Language differences
Organizations are often constrained to use particular language for many reasons such as corporate style.
This can result in internal language; acronyms or jargon being spread across a site - language that doesn’t match what a user knows (or cares) about.
An example of this is the difference between lawyer (in common usage it’s used to refer to basically any legal practitioner) and more technical terms used such as barrister, King’s counsel etc. From an end-user point of view these terms should be equated.
Another common problem is the use of acronyms, such as UK, HK, USA etc.
Synonyms can be used to transform user language into internal language by equating or expanding the terms.
Examples:
-
When a user searches for lawyer search internally for lawyer OR solicitor OR barrister OR kc OR "king’s counsel"
-
When a user searches for UK search internally for "United Kingdom" OR UK
Note: United Kingdom is specified as a phrase to ensure the expansion only matches when the phrase is present.
Common misspellings
Funnelback will automatically return spelling suggestions for user queries. However why not automatically correct the query where the intent is obvious if the non-matching query log indicates a high number of queries with incorrect spelling. This reduces a click for the user and improves the user experience.
Synonyms can once again be used to automatically correct the spelling.
For example: When a user searches for goverment search automatically for government.
Controlling what gets indexed
Significant improvements can be made to the relevancy of search results by thinking a bit about what content within a website should be included in the search.
There are a few mechanisms available that can be used to focus the content included within the search:
For example:
-
web standards such as
robots.txtand robots meta tags. -
Funnelback specific configuration such as defining include/exclude rules and no-index tags.
Robots.txt
The robots.txt standard specifies a site configuration file (robots.txt) and some meta tags that can be used to control web robots such as Funnelback.
Robots.txt can be used to instruct Funnelback (and other web robots) to ignore complete folders within your website.
The robots.txt file is read when the Funnelback first visits the site and every new URL is checked against the robots.txt file before it is downloaded and included in the index.
Robots meta tags can be placed within the header of the page to tell a web robot whether to index and follow any links in the page containing the meta tag.
This can be used to exclude certain pages from being indexed without stopping Funnelback from crawling through the site.
Include/exclude rules
Funnelback provides configuration options for defining what should be included and excluded from a crawl of a website. These include/exclude patterns and strings of text that are matched as substrings or regular expressions against the URL. Any URL that doesn’t match a pattern (include/exclude) it will be rejected by the web crawler.
No-index tags
Funnelback also provides site administrators with the ability to mark sections of a page as containing content that should not be indexed. These tags can be used to hide navigation and page headers and footers from the indexer. This means that the search results will only match within the content area of a page.
Noindex tags can usually be included within a site template and are an excellent and low cost method of improving search relevancy.
