Part 5.1: Debugging and Logging
This tutorial provides some high level advice on debugging problems with your plugin and the logging options that are available.
It is inevitable that there will be problems encountered during development of a plugin. When this occurs there are various techniques and tools available to help determine the cause of any problems encountered.
Adding logging throughout your plugin
Logging is a mechanism in which you output messages that let you check your expectations in a running program. The log4j2 logging framework is used by plugins to assist in writing log messages that can be configured in Funnelback. When writing plugin code log messages can be added to write out messages to a file - and you can control the levels of detail by making use of log levels.
Log Levels
When a log message is defined in the code you also define the log level at which the message will print.
Log4j has six log levels, ordered in priority:
fatal
error
warn
info
debug
trace
The plugin archetype configures a logger for you already,
private static final Logger log = LogManager.getLogger(TitleprefixSearchLifeCyclePlugin.class);To use this logger object (and write at INFO level) you do the following:
@Override public void postProcess(SearchTransaction transaction) {
  log.info("Running title-prefix plugin");
}
When the plugin runs it will run with the log level set at a particular level (which can be changed via configuration). This log level acts as a base threshold and any log messages of this level or higher will be printed.
This means that if Funnelback is configured to log messages of debug or higher, your message will appear in the logs. However, if it is configured to only show messages of warn, the message will not appear as info messages are of a lower priority.
Since a plugin can interact with Funnelback in different ways, the specific log file that they output to depends on the type of interaction it does. The following table tries to outline where different interfaces will output their logs to and where the log level can be configured.
| Interface | Log output files |
|---|---|
gatherer |
Data source gatherer logs |
filtering |
Data source gatherer logs |
jsoup-filtering |
Data source gatherer logs |
indexing |
Data source indexer logs |
facets |
Results page user interface logs |
search-servlet-filtering |
Results page user interface logs |
searchLifeCycle |
Results page user interface logs |
See: Funnelback logs reference for the specific log file names for different data source types.
Increase the log level for search lifecycle plugin and search servlet filtering plugin testing
Search lifecycle and search servlet plugins run within the public UI.
The public UI provides a special header that can be supplied when making a request that increases the logging to TRACE level.
Increase the log level for other plugin types (non-push data sources)
| This feature is not available in the Squiz DXP. |
To configure the log level for all other plugins:
-
log into your plugin test server via SSH
-
create a
logj2.xmlfile in your data source’sconfdirectory. The easiest way to accomplish this is to copy the default logging file that comes with Funnelback into your data source’s conf folder and modify it for your package.$ cp $SEARCH_HOME/conf/log4j2.xml.default $SEARCH_HOME/conf/<DATA-SOURCE>/log4j2.xml -
Then modify it by adding a new entry:
log4j2.xml<Logger name="com.example" level="trace" /> (1)1 Set any package that starts with com.exampleto log messages at thetracelevel or higher.The value for the
nameproperty should be thegroupIdorpackagename that was used to create our project.
Remove the log4j2.xml file once you have finished testing to prevent production log files from receiving debug logging.
|
|
If your plugin is not logging anything while developing and your not sure if you’ve configured the log levels correctly, you can use a higher priority log level. For example, This is likely to be shown, but ideally, you should clean that up again before sending your plugin for review on the marketplace. |
Increase the log level for other plugin types (push data sources)
| This feature is not available in the Squiz DXP. |
Plugins will also be run as part of push data sources. These will appear either in the above locations or in $SEARCH_HOME/web/logs/push.log
Push data source logging is global and the log messages from plugins run on push data sources will be logged via this global configuration. Push data source logging can be configured using $SEARCH_HOME/web/conf/push/log4j2.xml.
| Changing the push data source log configuration will affect all push data sources on the Funnelback server and should only be set on a local development VM. |
Exercise
Follow the examples above to create a logging file for the results page you made earlier. Then change the data source configuration to refer to the wrong key.. For example,configure the plugin with incorrect key names (plugin.titleprefix.pattern instead of plugin.title-prefix.pattern).
plugin.titleprefix.pattern=Product Documentation |
plugin.titleprefix.replaceWith=Funnelback Documentation v16 |
Perform a search and then look in modernui.Admin.log. You should see something similar to:
2020-04-23 15:25:40,141 [admin-3067442] [example:_default_preview] WARN titleprefixplugin.TitleprefixSearchLifeCyclePlugin - Could not find a pattern specified at plugin.title-prefix.pattern. The Titleprefix will do nothing.
Debugging using your IDE
While logging is useful for debugging plugins that have issues when running on the Funnelback instance itself, it might be more useful to debug issues that you run into while developing. This is where the IDE (IntelliJ IDEA in our case) can start to help us step through problems much quicker.
Assuming we had a working project, lets inject some flaws and see how a debugger might help us track it down. For now, lets pretend that in TitleprefixSearchLifeCyclePluginTest, the test methods we created looked instead like this:
   @Test (6)
    public void testPostProcess_with_replacement_pattern() {
        testInput
                .withProfileSetting("plugin.title-prefix.config.pattern", "ExampleCorp -")
                .withProfileSetting("plugin.titleprefix.config.replaceWith", "EC |"); (1)
        pluginUnderTest.postProcess(testInputContext, testInput);
        Set<String> expectedResultTitles = Set.of(
                "EC | Fake search data to take home",
                "EC | Another result with the same prefix",
                "This result does not match the pattern");
        List<Result> mockResults = testInput.getResponse().getResultPacket().getResults();
        Set<String> actualResultTitles = mockResults.stream().map(finalResult -> finalResult.getTitle()).collect(Collectors.toSet());
        Assert.assertEquals("the pattern should have been replaced with the new one", expectedResultTitles,actualResultTitles);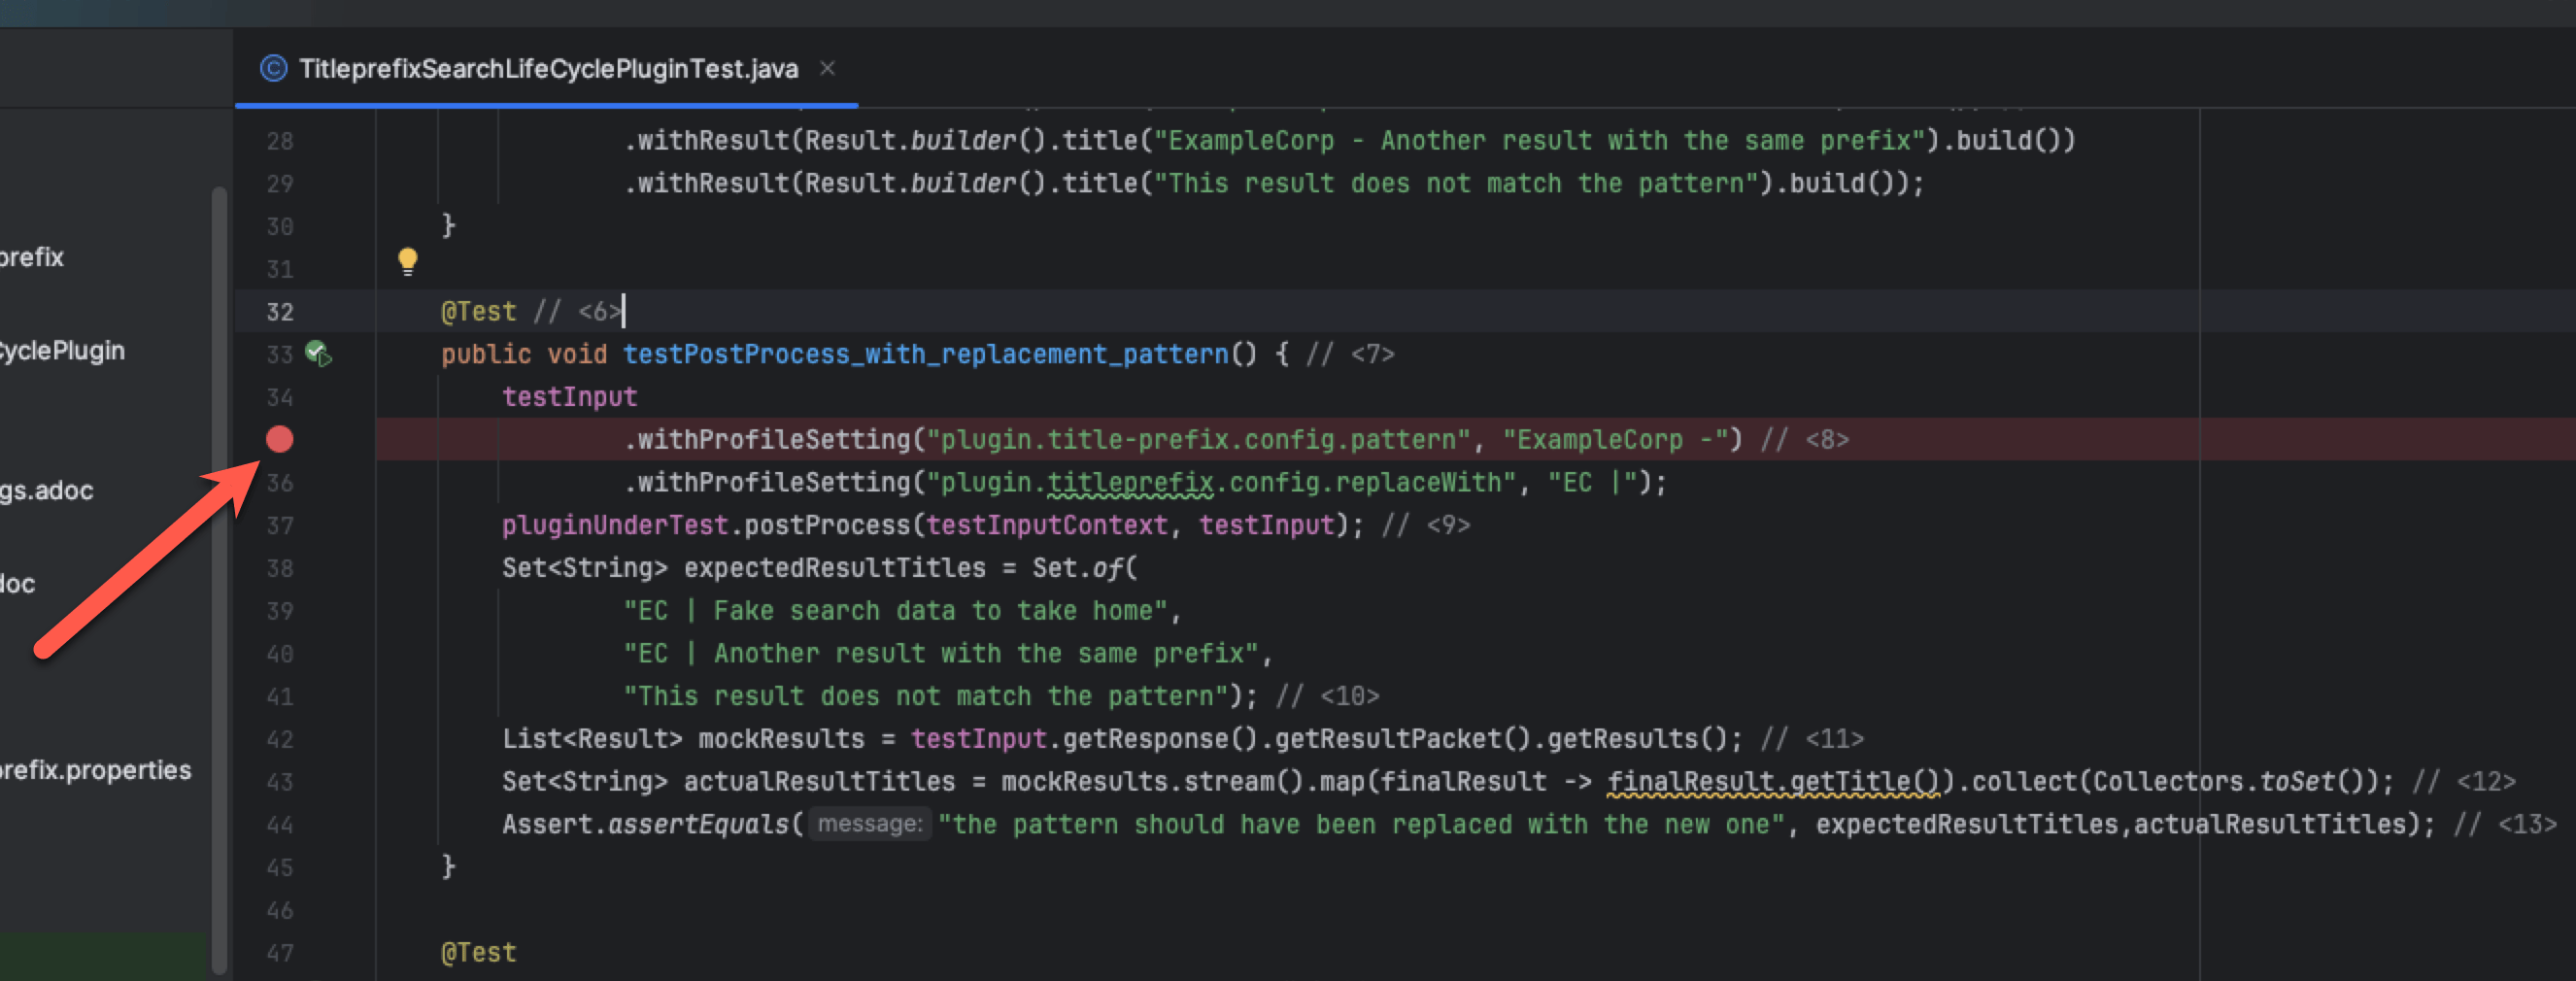
}| 1 | Note, we have just changed one of the results page settings to have different keys. Now when we run the test, we’ll notice that testPostProcess_with_replacement_pattern fails, but not really be sure where things went wrong. The trick is to put breakpoints in our code and step through the test. |
Open the plugin code: TitlePrefixSearchLifeCyclePlugin, and on line B, (the first line of postProcess), add a breakpoint by clicking next to the line of code number. A little red dot will appear if you’ve done it correctly. A breakpoint lets us pause the execution of the code and inspect each of the values step by step.
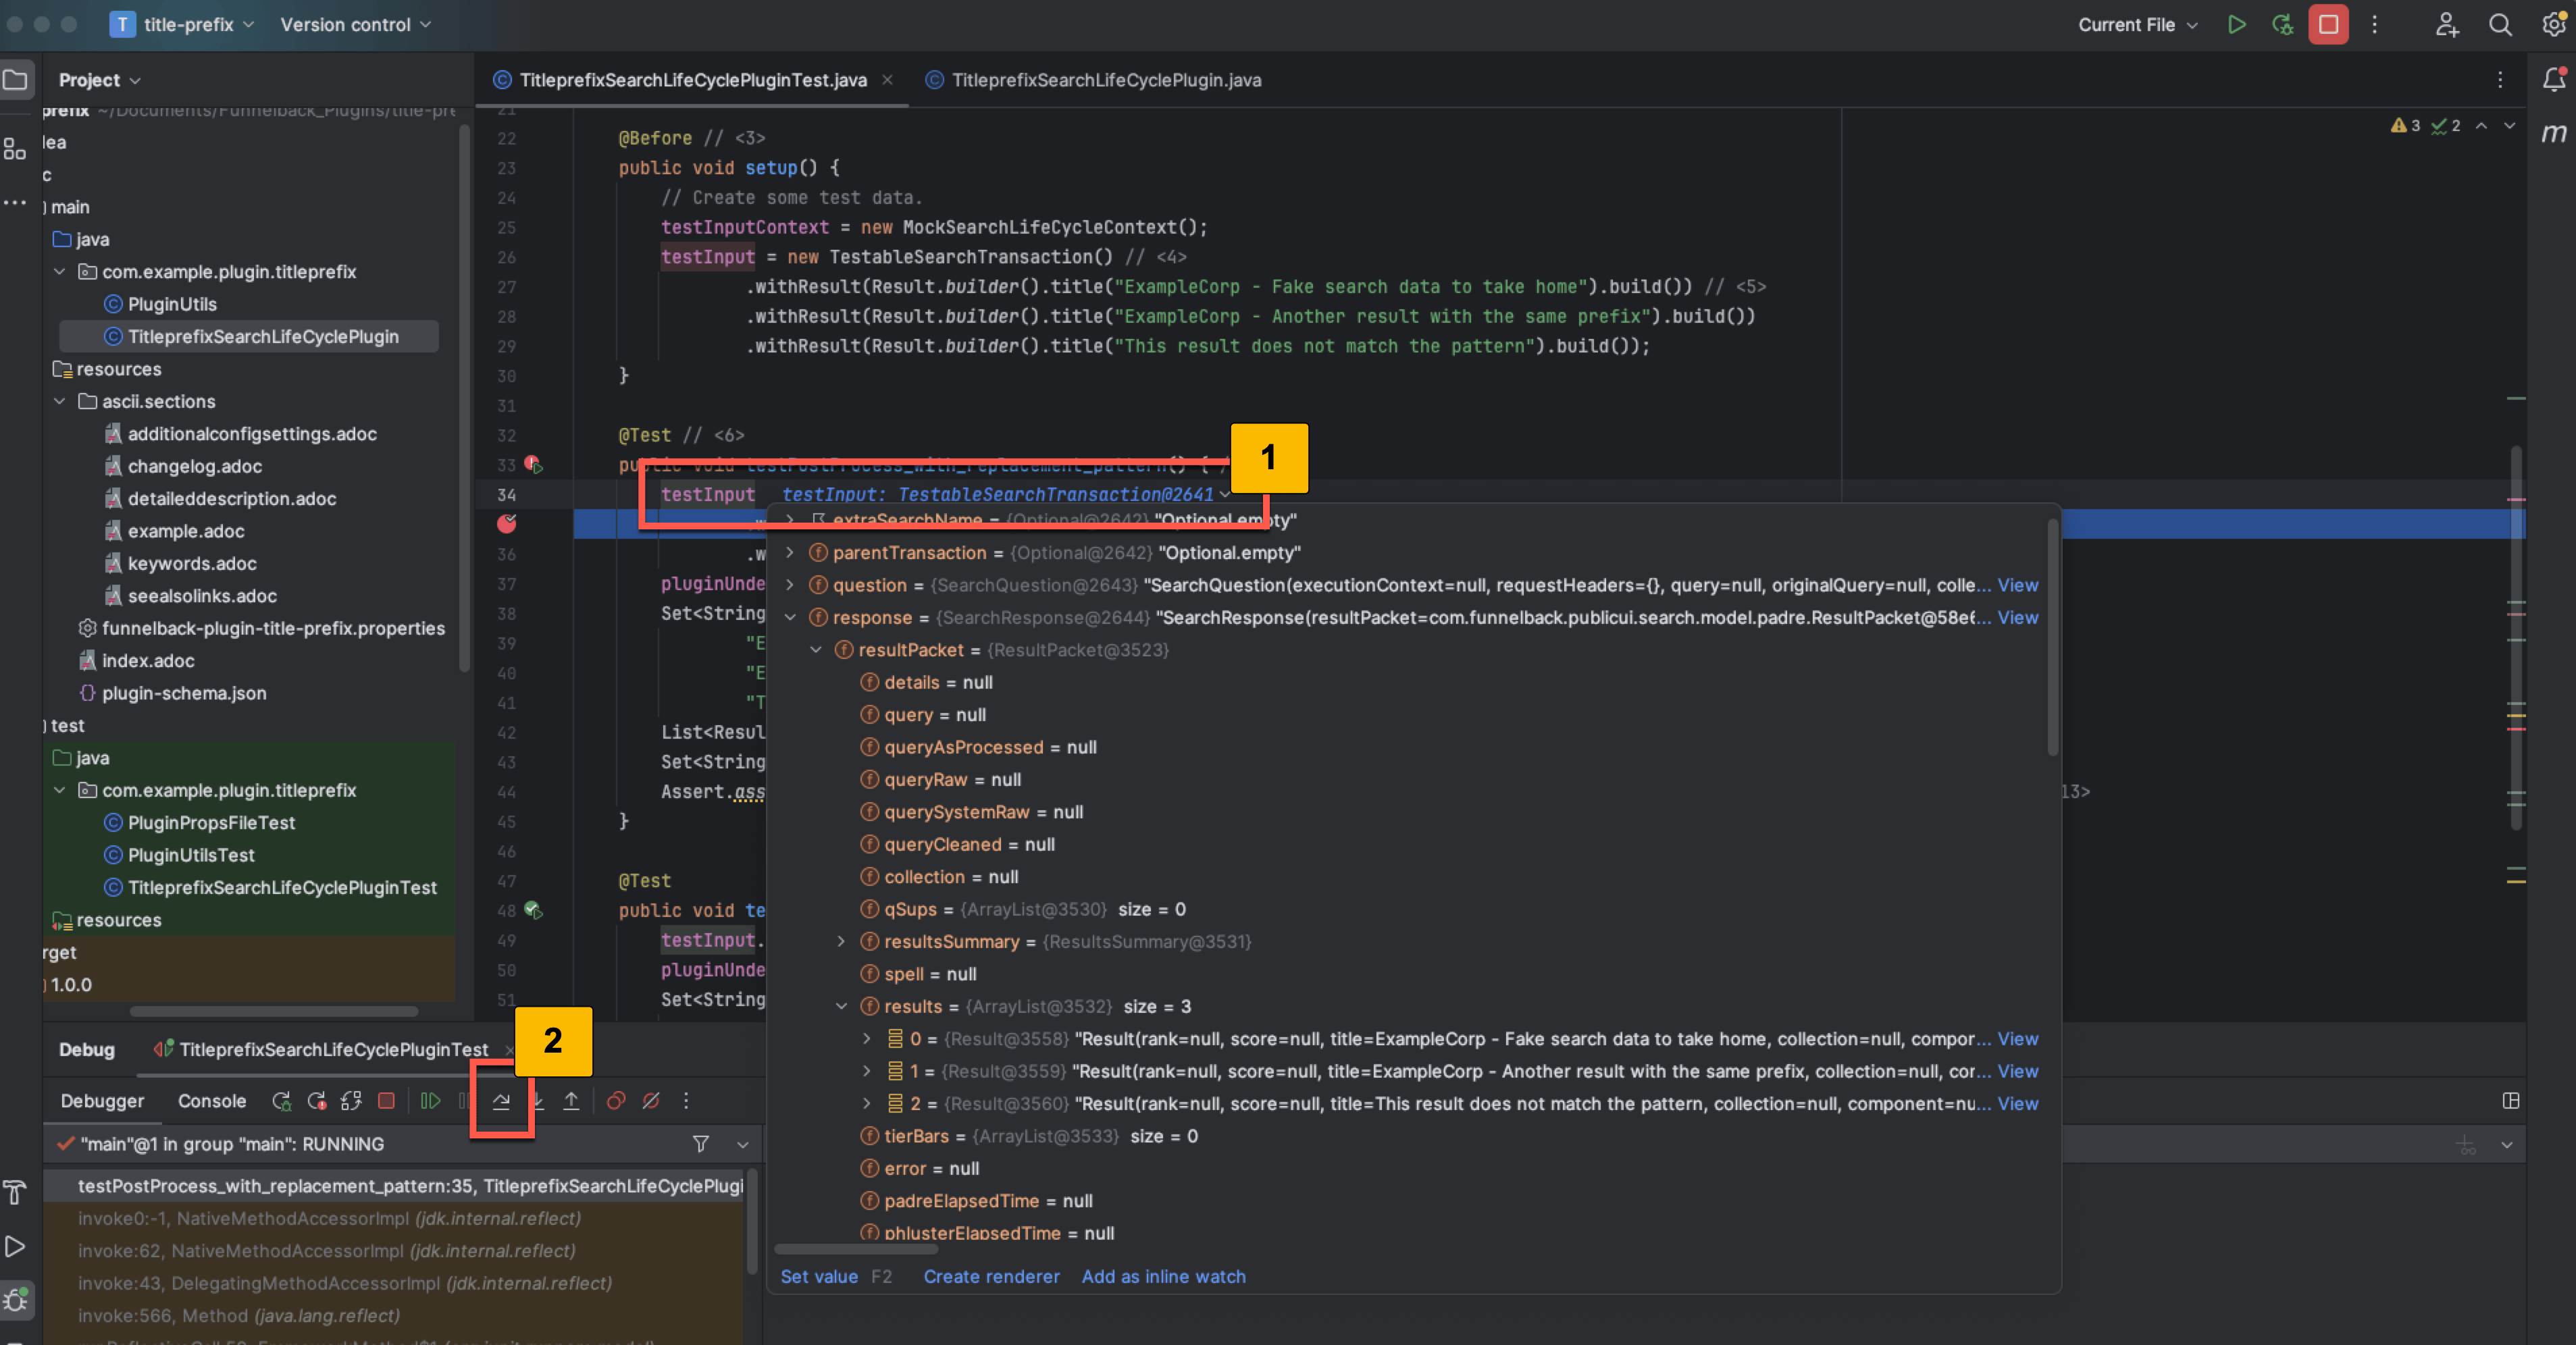
Next, run the test in debug mode by (Ctrl+D) and you’ll notice that the code stops part way through. From here, you can hover over certain objects to look at their value. For example, if you hover on transaction and explore it, you’ll be able to find the fake results we configured earlier.
-
Inspect an object. The objects can also be inspected in the debugger window at the bottom of the screen.
-
Step over to the next line of code
Press the Step Over button and it will execute the next line and you can observe the changes in the data model.
Other questions you may have
How do I know that my plugin was installed correctly?
Log in to the Funnelback search dashboard and click on plugins in the navigation. Your plugin should be listed along with any other installed plugins.
| You can’t search for your plugin using the filter box as this search only covers the released plugins. |
If it is not displaying then you may wish to check the following:
Login to the Funnelback server and check the contents of the $SEARCH_HOME/share/plugins directory. This should contain a folder for each installed plugin.
Check that the plugin you are interested in is here and that the folder contains appropriate file permissions (user and group permissions should be set to the search user), and also check that the structure of the sub-folders is correct (compare this to other plugin on the system or refer back to the structure shown when packaging the plugin.