Using performance mode to measure asset performance
Learn how you can use performance mode to analyze the load time of assets within the system, presenting the results of these analyses on in-depth timeline charts.
| You must have at least write access to the asset to run performance mode. Your user account type must have access to admin mode. |
Performance mode is especially useful in locating problem areas or assets that may be causing excessive load times, to help you identify and resolve performance issues.
Accessing performance mode
You can access performance mode by appending _performance to the URL of any asset:
http://www.example.com/site/_performance
If the asset is a supported asset, Squiz Content Management analyzes the performance of the assets loaded on the URL. Once the performance of your asset is analyzed, results display at the bottom of your browser.
Supported assets
While you can analyze assets in performance mode, only supported assets loaded on a URL display in the performance results. The following asset types support detailed analysis in performance mode:
-
Asset builder page *
-
Asset listing page *
-
Calendar page
-
Custom form
-
Data source assets
-
Designs and design customizations
-
Paint layout
-
Remote content
-
Search page (incl. search manager) *
-
Standard page
-
Trigger
-
REST asset
* Also supports individual asset step analysis. For more information, refer to the Asset Steps section in this chapter.
You can continue to navigate around your Site while in performance mode. Each time you load a new asset, it’s performance is analyzed, and the results displayed in your browser.
Performance mode interface
The performance mode interface contains the following elements:
- Total time
-
Displays the total time taken to load the asset.
- System
-
Indicates the portion of time attributed to system processing—the remaining time associated with individual asset loading.
- Queries
-
Displays the total time taken by queries run when the asset loads, as well as listing a count of the total number of these queries.
- Caching button
-
Lets you examine the impact of caching on your assets. Click the Caching button to re-analyze the asset with the new caching method and show the performance results.
- User button
-
Lets you switch between viewing the asset’s performance as the default user (the user currently viewing the asset) or a public user. Click the User button to re-analyze the asset with the new user type and show the performance results.
| If you change the User or Caching settings, these settings are maintained as you navigate through the assets in your Site. |
- Asset Count
-
Lists the total number of assets that have been loaded and analyzed within the performance mode results.
- Slowest
-
Displays a graphical measure of the slowest five assets to load. The five assets that take the longest time to load display in the Performance Results Graph.
Performance results graph
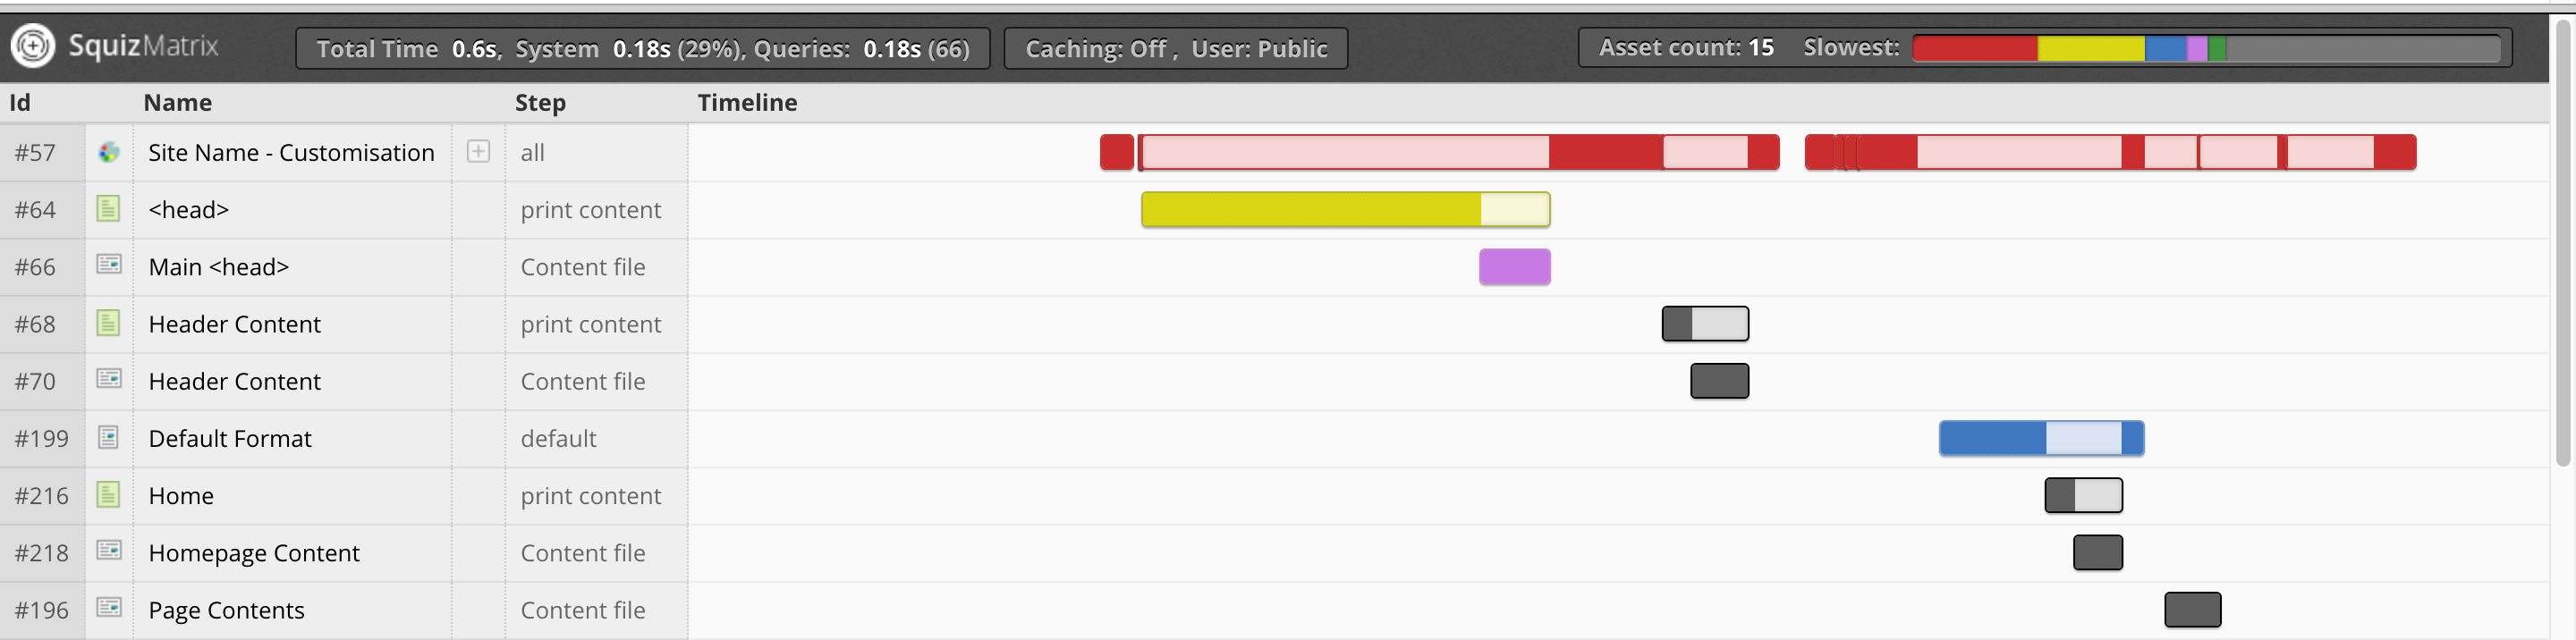
The performance results graph displays a list of the analyzed assets on the URL, alongside a graphical timeline of the loading of these assets.
On the left side of the performance results graph, the assets loaded on the URL display in chronological order. For example, in the graph below, our "Community - Default - No Left Col - Customisation" design customization is the first analyzed asset to be loaded on this particular URL.
The performance graph also shows the asset ID, asset type, asset name, and step type for each asset. See the Asset steps section for more information on Step types.
The right side of the performance results graph shows the timeline. Each asset has a performance bar graphically outlining the total load time of the asset.
These performance bars indicate when the asset was actively loading (dark) and when the asset was idle, due to other loading assets (light). The total load time of the asset determines the status color assigned to the asset.
| Color | Description |
|---|---|
Red |
Slowest asset to load. |
Yellow |
Second slowest asset to load. |
Blue |
Third slowest asset to load. |
Purple |
Fourth slowest asset to load. |
Green |
Fifth slowest asset to load. |
Grey |
Not among the slowest loading assets. |
A graphical representation of the five slowest loading assets displays in the Slowest field. For more information, refer to the Asset Count and Slowest Loading Assets Fields section in this chapter.
Hovering over an asset’s performance bar displays the total and active load times for that specific asset, the run time, and the total number of queries.
Asset steps
Some asset types, such as an Asset Listing Page, can contain multiple steps during loading. Performance mode lets you break these assets down and analyze the individual performance of each step.
Select ⊞ to expand the asset’s performance bar into individual steps in the list of analyzed assets to show the asset broken down into its load steps.
Understanding the performance results
The results returned in performance mode allow you to identify at which point your system’s assets are causing the most significant drain on performance. The following example explains how to interpret and utilize these results.
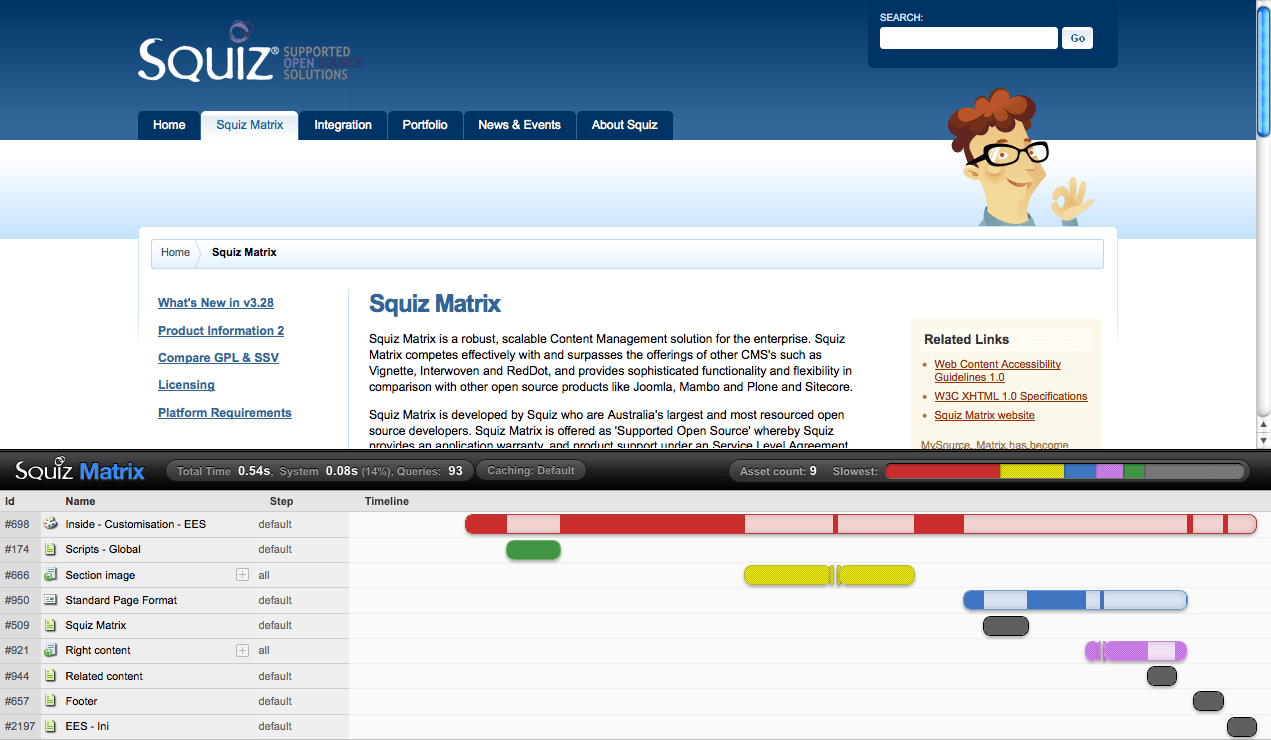
In this example, the URL takes a total of 0.54 seconds to load, with 0.46 seconds (76%) attributed to individual asset load time.
The colors of the assets on the performance timeline indicate which assets took the longest time to load.
The Design Customisation of the page (asset #698) is colored red, as it has taken the longest time to load. The second-longest asset to load was the Section Image Asset Listing Page (#666) in yellow, followed by the standard page Format Paint Layout (#950) in blue. The Right Content Asset Listing Page (#921) in purple is next to load, and finally, Scripts - Global Standard Page (#174)in green.
Looking at the timeline, asset #698 begins actively loading first. It is then idle for a short time while asset #174 loads - nested JavaScript content in the design. The asset then continues loading for a significant length of time. Rendering the main navigation menu and search bar design areas of the asset’s design appears to affect the load time.
The "Design Customisation" is again idle while asset #666 loads. This asset is a nested "Asset Listing Page" that prints the cartoon figure in the asset’s design and is the second slowest asset to load.
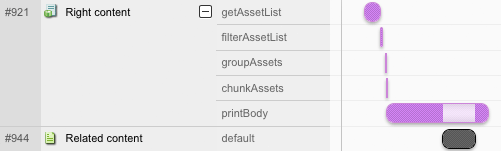
Expanding the Asset Listing Page tells us that the getAssetList and printBody processes take the longest amount of time to load. In contrast, the filterAssetList, groupAssets and chunkAssets load time is minimal.
Once this listing loads, the Design Customisation renders the Design Areas displaying the asset lineage and sub-menu. After this, asset #950 - a Paint Layout nested in the design - is loaded. This asset prints the current asset (#509) and asset #921, an "Asset Listing Page" on the right side of the page.
This Asset Listing Page prints the content of asset #944 during its printBody step, seen when we expand the listing on the performance timeline.
Once the main content of the page is loaded, assets #657 and #2197 load. These assets contain the footer content of the page and a simple Easy Edit Suite JavaScript plugin; they are not significant to the URL’s overall load time.
From these results, you can focus your attention on the most significant impacts on performance for this URL:
-
loading the search bar and main menu design areas on the design customization
-
loading the Asset Listing Page that lists the cartoon figure.