Log manager
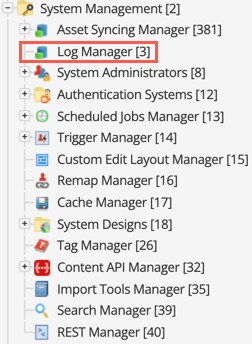
The log manager allows you to view the Squiz Content Management system log files and is located under the System management folder in the asset tree.
| Only log file events originating from within Squiz Content Management are listed in the log manager. |
To view the system logs, go to the Details screen of the log manager and click on the Monitor button for the log message type you wish to view.
Details screen
The Details screen of the log manager allows you to view the system log files.
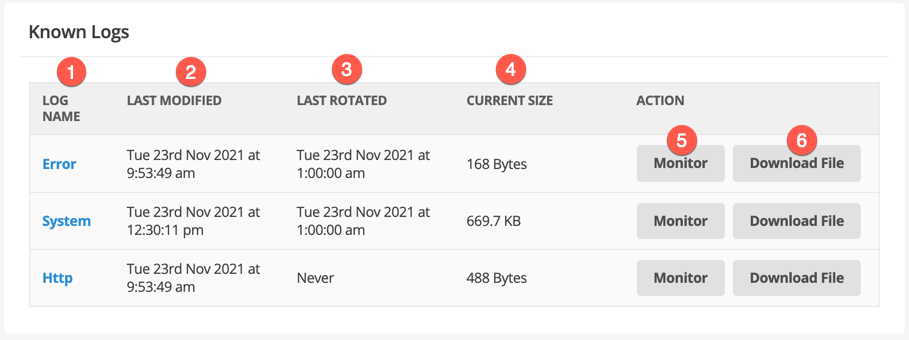
Known logs
Logs are created only when an event triggers a log entry. For example, if your system has not received any performance alerts, this file has not been created by the system and therefore does not appear in the list.
-
The log name from the list of known log types. System log type codes include:
- Error
-
All PHP errors are logged in this log file, including the system or database access errors at the top of a user’s screen within Squiz Content Management.
- Search
-
All search queries and results for the Squiz Content Management search page are logged in this log file.
- System
-
All Squiz Content Management system-generated messages are logged in this log file. For example, the creation of new assets, attribute changes, and configuration changes.
- Asset cache
-
When the
sq_conf_debugconfiguration setting is enabled in the system’smain.incfile, Squiz Content Management will log incorrectly cleared internal caching object information. - Cron errors
-
All scheduled job errors are logged in this log file.
- Form ecommerce order
-
Logs the usage of ecommerce form page assets.
- Performance
-
Performance alerts are logged in this log file, including when a listing asset, such as an asset listing page, attempts to list over 1000 items on a single page. System administrators use this log to determine any noticeable performance issues on the system quickly.
-
The date-time that the log was last updated with log events.
-
The date-time that the log was last rotated in the system, as described in Log file rotation.
-
The current size of the log, which can be useful in adjusting rotation schedules and whether downloading the log file for analysis could take a long time.
-
Opens the Monitor logs section for the selected log type.
-
Downloads the full log file for analysis.
Monitor logs
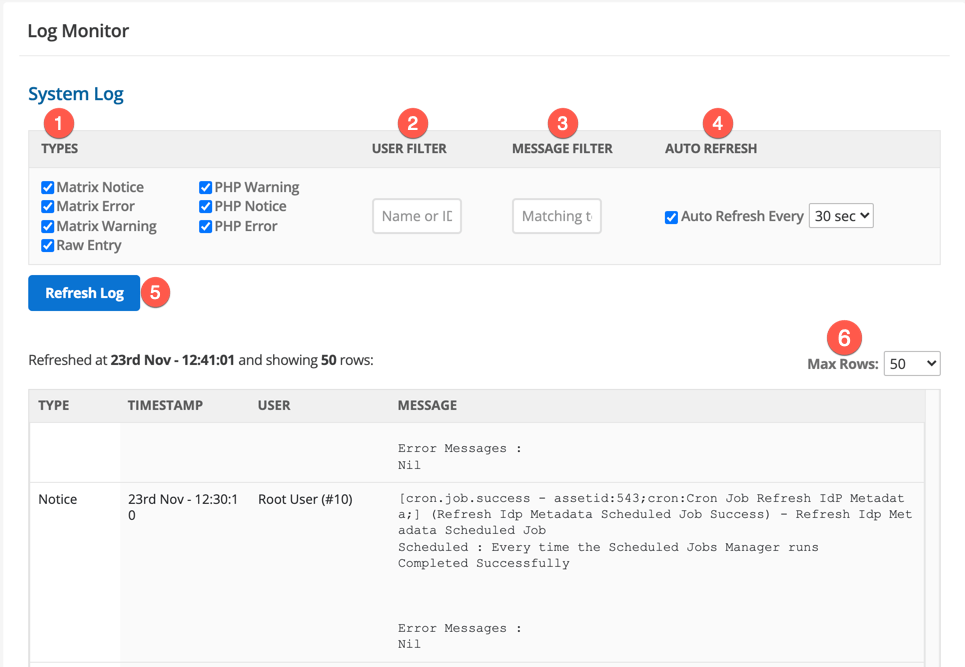
Select Monitor to get access to filtering options for the selected log. The name of the log type you are viewing is shown above the filter options. The messages of that log will appear in the Log monitor section below.
-
Select one or more types to refine the returned results.
-
Specify the user ID or name for which to filter results.
The User filter option is particularly useful if you are trying to diagnose a reported problem with a specific user ID or user name in the USER column. -
Specify a string for which to filter results.
The Message filter option is useful when you want to find a specific error text string, rather than a more general log type. -
The message list is updated every 30 seconds by default.
You can select to refresh the list every 15 seconds, 30 seconds, 1 minute, or 5 minutes. To stop the refresh from happening, clear the check-box.If you disable the refresh, you can update the list manually by clicking the Refresh now button. -
Select Refresh Log to refresh the list of log messages.
-
Select Max rows to change the number of currently displayed messages. By default, 50 rows will be displayed. You can select to show either 10, 50, 100, 500, or 1000 rows. The screen refreshes once you select a value from the list.
Log file rotation
The log files for the system are stored in the /data/private/logs directory.
These logs are rotated once every 24 hours.
When the log is first created, it is given the name <logname>.1.
The next day, the new log is rotated to "<logname>.2", and so on until <logname>.10 is reached.
The rotation index is then set back to 1, and the existing file named <logname>.1 is overwritten, and the cycle continues.
Log types
Some log types are specific to certain actions or events that happen in Squiz Content Management.
Outbound REST resource HTTP request
An HTTP log is created whenever an outbound HTTP request is made by one of the following Squiz Content Management features:
The log structure is the same as the following outbound GET request example. This structure does not change regardless of the following parameters:
-
whether the outbound request was successful or not.
-
the response code from the external server.
All HTTP REST logs are compliant with Newline Delimited JSON and https://github.com/vectordotdev/log-event-json-schema standards.
Successful request
The log has the same structure as this example of an outbound GET request. In this example, the request received an HTTP 200 OK response.
The file is annotated to explain the structure of the log file.
{
    "dt": "2021-11-08T15:35:31.512866+11:00", (1)
    "level": "info", (2)
    "message": "GET https:\/\/httpbin.org\/status\/200", (3)
    "context": { (4)
        "http": {
            "method": "GET" (5)
        },
        "user": { (6)
            "id": "10",
            "user_full_name": "Root User",
            "username": "root"
        },
        "custom": {
            "asset_id": "205" (7)
        }
    },
    "event": { (8)
        "http_response": {
            "status": 200,
            "headers": {
                "content_type": "text\/html; charset=utf-8",
                "header_size": 236
            },
            "content_length": 0,
            "direction": "outgoing",
            "time_ms": 1380.52,
            "request": {
                "host": "httpbin.org",
                "method": "GET",
                "path": "\/status\/200",
                "schema": "https"
            }
        }
    }
}| 1 | The date-time of the request in ISO 8601 format. |
| 2 | The 'type' of log, according to PHP-FIG PSR-3 Logger interface. |
| 3 | A message that describes errors if the request fails. |
| 4 | A contextual object containing information about the request and the Squiz Content Management system. |
| 5 | The request type and method used in the request. |
| 6 | information about the Squiz Content Management user that initiated the outgoing request. |
| 7 | A highly contextual object of information that can be considered "meta" in nature. In this case, the value is the ID of the asset, trigger, or form that fired the request event. |
| 8 | An object describing the event that caused the log event. |
Failed request
If the request itself fails, the log takes the same format with the message field indicating the problem encountered:
| Common examples of failed requests include incorrect request URLs or a timeout from the external server. |
{
    "dt": "2021-11-09T13:39:20.904055+11:00",
    "level": "alert",
    "message": "cURL error (6): Could not resolve host: fooadsf; Unknown error", (1)
    "context": {
        "http": {
            "method": "GET"
        },
        "user": {
            "id": "10",
            "user_full_name": "Root User",
            "username": "root"
        },
        "custom": {
            "asset_id": "205"
        }
    },
    "event": {
        "http_response": {
            "status": 0,
            "headers": {
                "content_type": null,
                "header_size": 0
            },
            "content_length": -1,
            "direction": "outgoing",
            "time_ms": 85.69,
            "request": {
                "host": "fooadsf", (2)
                "method": "GET",
                "path": "\/",
                "schema": "http"
            }
        }
    }
}| 1 | The message specifically indicates an error with the host. |
| 2 | You can use the error to determine that the value for the host is invalid. |