Platform Behaviour
Introduction
This chapter provides information on
-
current platform safeguards;
-
imposed limits;
-
and errors that can occur when these limits are exceeded.
It describes common errors connected to these limits and offers recommendations for preventing or addressing them.
Users and administrators can ensure a stable and secure experience on the platform by understanding these limitations and safeguards.
Default Limits
This table lists Integrations Service platform parameters and their default values.
You can configure the Integration Service platform to impose limits that are not these default values.
| Limit Name | Description | Value |
|---|---|---|
Queue message number |
Processing queue message count limit. More information in Messaging Queue Limits. |
75,000 |
Queue message size |
Processing queue combined size limit in megabytes (MB). More information in Messaging Queue Limits. |
200 MB |
Outgoing message size |
Total outgoing message size from any integration step in megabytes (MB). |
10 MB |
Error Retention |
The limit on the platform’s Number of Errors will display in case your integration flow starts spamming the system. After this limit is reached, errors will not be shown. |
1,000 |
Sample retrieval timeout |
Time in minutes that the platform will wait during the data sample retrieval in the flow step design. After this, the process will stop with a timeout error. |
1 min |
Limited Workspaces |
Time in hours until flows stopped in Limited Workspaces. |
8 h |
Container RAM |
Total processing memory (RAM) in megabytes (MB) allocated to a running pod in Kubernetes cluster for Node.js and Java-based components. Exceeding this limit can cause OOMKilled errors. |
1024 MB |
Container logs TTL |
The number of days container information is stored on the platform. |
30 d |
Executions TTL |
The number of days during which execution details are stored on the platform. |
30 d |
Logs TTL |
The time in days that logs information is stored on the platform. |
14 d |
Input messages TTL |
The time in days that the messages that led to the error are stored on the platform. |
5 d |
Max number of requests to Webhooks per Contract |
By default, the platform allows 240 webhook requests per minute at each contract level. If the requests exceed 240 per minute, they will be rejected with an error, and no messages will be queued. |
240 calls/min |
|
These are default values. Some of them — RAM, for example — can be changed in a custom component. |
The platform also has set limitations on accepting, processing, and exporting attachments. See the Using attachments documentation for more information.
Messaging Queue Limits
The platform processes messages in queue order to ensure stable processing.
Each integration flow step has a dedicated messaging queue, with limits on message number and size to maintain stability in RabbitMQ.
These limits can be adjusted for the whole system or individual flows if necessary. Contact support for assistance with your particular use case.
If the queue limit is reached, the platform pauses processing until the message number or combined queue size drops according to Dynamic Flow Control. This is done to ensure no messages are lost.
To use this mechanism, components must be built with the following version of Sailor or later:
| Architecture | Minimum version |
|---|---|
Node.js |
2.6.7 |
Java |
3.1.0 |
|
If a flow uses an earlier version of Sailor in a step and the queue reaches 80% (60K) capacity:
|
Flow suspension
In rare circumstances, the platform can temporarily suspend integration flows to maintain system stability.
These temporary pauses ensure the continuous functioning of the system and allows for continued processing after resolution.
When a flow is suspended, an email notification is sent to a designated email address.
Suspended flows can be manually resumed or terminated for further investigation.
Flows stopped in limited workspaces
The platform pauses integration flows in limited workspaces after a set time limit to maintain resource stability.
This interval can be reset by logging in and restarting the paused flows.
If a use case requires extended, uninterrupted run times, contact support to convert the workspace to a production type.
|
Limited workspaces are intended for platform testing. In limited workspaces, when integration flows are paused, unprocessed messages are discarded. |
Component failed to start
If a component fails to start, an error message presents:
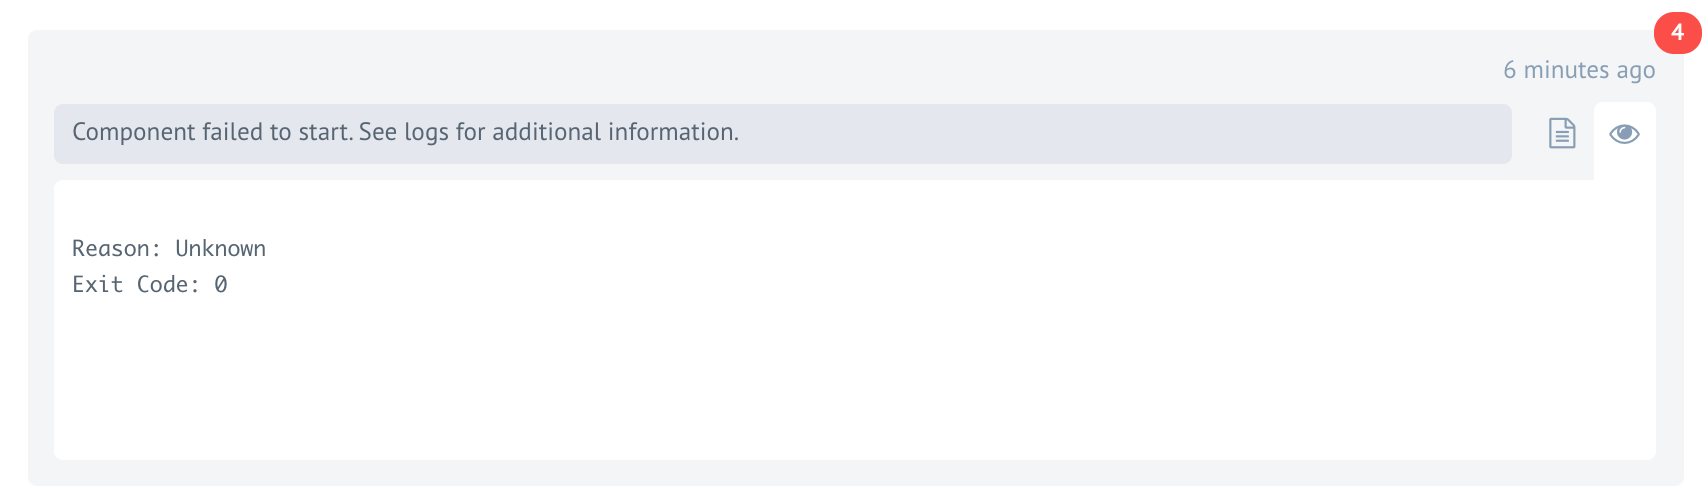
This is uncommon, but components can fail to start because of process over-subscription in the Kubernetes cluster node where the process is initially started.
In such a circumstance Kubernetes can remove the pod and restart it on a less crowded node.
In most cases, this recovery takes less than a second and does not disrupt the flow.
Component runs out of memory
Each component in the Kubernetes cluster runs within its container pod. If a component consumes more memory than allowed, the platform terminates the process.
This can result in an Out of Memory error with exit code 137.
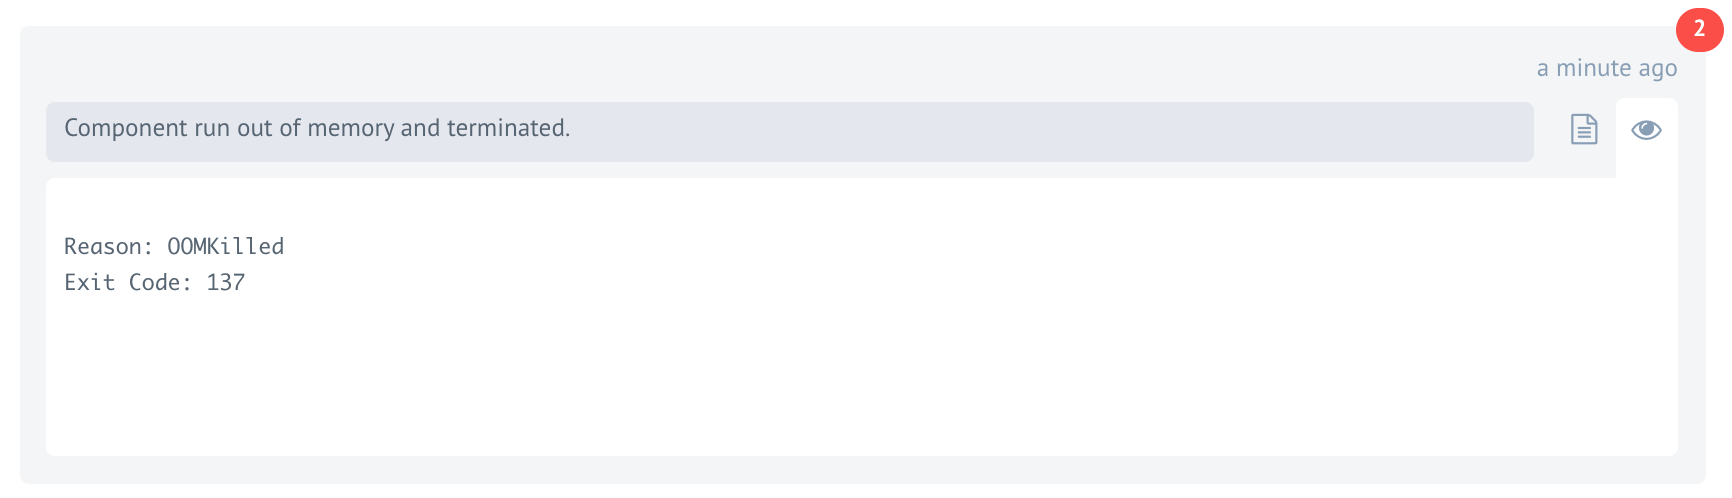
To identify the root cause, review the component logs from the execution page.
|
In the case of Out of Memory errors with exit codes of 137 , the log message can be lost or incomplete. |
If multiple steps in your integration flow consistently fail, contact support.
Optimise component or integration logic
When processing large data sets, a component can run out of processing memory due to internal data creation or the combination of incoming data and internal compute processes.
For example, splitting a large data array can lead to even larger data sets to process.
If such problems occur in a component, consider optimizing data processing by reducing the data processed at each execution instance. Run local tests with typical data to specify the issue and detect potential memory leaks in the code.
If the problems present in a system-provided component, examine the integration logic and reduce the amount of data sent to the affected step.
If the integration step still fails with an OOMKilled error, you may not see the complete incoming data due to Passthrough. Disabling Passthrough can help resolve the issue.
Give more processing memory
By default, the platform sets limits on allocated and requested processing memory for each pod in the Kubernetes cluster.
In some cases, however, allowing more processing memory (RAM) is the only way to solve out-of-memory errors. Check if your custom component has such a requirement and set it accordingly
In general, Java-based components require more RAM than Node.js-based components.
There are set recommendations for the minimum amount of RAM to allocate to each component. If a component is presenting out-of-memory errors, check if the component has such a recommendation and set it accordingly.
Flow control
Introduction
The Integrations platform enables integration across various applications and systems by employing dynamic and static flow control mechanisms.
Dynamic flow control manages data flow in real time.
Static flow control uses predetermined rules.
Understanding the distinctions between these two methods is crucial for optimal data integration, ensuring efficient, reliable, and scalable processes.
Static flow control
Static flow control sets a fixed data transfer rate, regardless of current performance or capacity. It is useful in predictable and stable situations.
If, however, the data flow rate is set too high or to low, Static flow control can cause problems.
It can cause data loss, latency issues, or other problems if the data flow rate is not adjusted based on real-time feedback from each application.
How static and dynamic flow control interoperate depends on the version of Sailor used to build a component.
Static and dynamic flow control and Sailor <3.3.5
Components based on versions of Sailor prior to version 3.3.5 offer no interoperability between dynamic and static flow control.
Static flow controls function as configured. If the maximum number of messages is exceeded, the flow is suspended.
Static and dynamic flow control and Sailor 3.3.5 or later
Components based on Sailor 3.3.5 or later, whether built with Node.js or Java, allow dynamic flow control to work with static flow control in real-time.
As listed in the [_default_limits] table, the message and message size default values are still in effect when static and dynamic flow control interoperate.
| Limit Name | Description | Value |
|---|---|---|
Queue message number |
Processing queue message count limit. More information in Messaging Queue Limits. |
75,000 |
Queue message size |
Processing queue combined size limit in megabytes (MB). More information in Messaging Queue Limits. |
200 MB |
If either of these thresholds is crossed, a restriction is triggered, and the message cannot be queued.
The system will, however, attempt to queue the message exponentially, resulting in retries with increasing backoff intervals.
Dynamic flow control
Dynamic Flow Control is based on RabbitMQ’s Publisher Confirms and Flow Policies. It allows for a dynamic slowdown of producers, based on the current queue state.
Each task queue has a message limit. When a queue overflows with messages, RabbitMQ’s reject-publish policy rejects publish requests to prevent further messages from being sent.
Sailor will, then, infinitely retry publishing until a message is successfully sent.
Sailor utilizes RabbitMQ’s Publish Confirm feature to prefetch a set number of messages and send confirmation back to RabbitMQ after processing each incoming message. By default the set number of messages is 1.
Processing ends when Sailor successfully sends a message to the next step, preventing any more messages from being sent until the queue is empty.
Finally, if connections are publishing too quickly, RabbitMQ’s Flow Control feature automatically reduces the connection speed to maintain a manageable rate of message ingress.
Dynamic flow control notes
-
When retrying erroneous messages, the messages are marked with the
retry=trueheader. This prevents Lookout from writing duplicate data records. -
Sailor retries publishing messages to the next step infinitely for cases where the next queue is overloaded.
-
Retries occur with exponential backoff. The first retry starts with a delay of 5 seconds. For each following retry the delay increases by a factor of 2.
Retry # Delay factor Delay 1
5 sec
5 sec
2
5 sec ✖️ 2
10 sec
3
10 sec ✖️ 2
20 sec
4
20 sec ✖️ 2
40 sec
5
40 sec ✖️ 2
80 sec
-
The maximum delay is configurable through environment variables.
-
The following variables control the retry process:
Variable Default value AMQP_PUBLISH_RETRY_DELAY100 ms
AMQP_PUBLISH_RETRY_ATTEMPTS♾️
AMQP_PUBLISH_MAX_RETRY_DELAY5 min
| Dynamic Flow Control affects Flow Queues. |
The disable dynamic flow control
Dynamic flow control can affect performance. It can be deactivated in some cases.
Deactivating flow control is supported
-
for steps using
sailor-jvm 3.3.5or later; or -
Webhook steps.
In these cases, a Dynamic flow control on-off switch presents in the UI during step configuration.
When dynamic flow control is deactivated for a step, the RabbitMQ Publish Confirm feature is not used by Sailors, and errors do not result in retries.
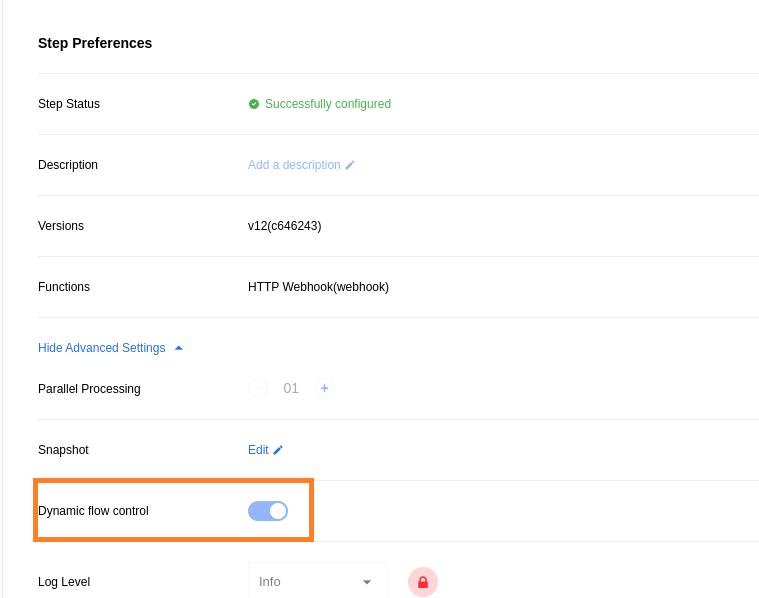
|
The Dynamic flow control UI is only available for Java components using Sailor 3.3.5 or later. For Java components using versions of Sailor previous to 3.3.5, dynamic flow control can only be deactivated by using an API call. And dynamic flow control cannot be deactivated at all in components built with Node.js. |
Use case
-
Webhook (new request arrives) → Step 1 Queue (overflowed) → Step 1 (processing two messages)
-
Webhook attempts to publish a message into the Step 1 queue, but RabbitMQ rejects the request due to overflow.
-
Webhook responds with a
429 Too Many Requestsstatus code.
-
-
Webhook → Step 1 Queue (2 messages) → Step 1 (parallel processing: 1, emits a message) → Step 2 Queue (overflowed) → Step 2 (processing two messages)
-
Step 1 attempts to process the messages, but RabbitMQ rejects the publish request due to queue overflow.
-
Step 1 will make infinite retries with exponential backoff until successful publication.
-
Until successful publication, the two messages in the Step 1 queue remain there.
-
E-commerce order management example
In an ecommerce order management system, timely delivery to customers is crucial.
To ensure this, orders are processed in real-time.
If there is a sudden order surge, however, the warehouse can become overloaded, leading to delayed deliveries.
Dynamic flow control solves this problem by monitoring the warehouse’s performance and adjusting the rate orders are sent to prevent overloading.
Additionally, the platform can adjust the order rate based on network conditions, such as latency or available bandwidth to ensure smooth processing.