Executions page
There are two levels of logging in the platform:
-
The Executions page includes a single record of every flow executed in the selected workspace
-
The Logs page lists all the logs for all the Flows executed in the selected workspace
This page defines what an execution is and how to use the Executions page to assess usage and troubleshoot issues.
Executions
An execution is the path of an initial message through a flow.
When the flow is triggered (by a scheduler, webhook etc.), the platform assigns an execution ID to the message.
This ID follows the message through the entire flow.
The same ID is assigned to any messages caused by this initial message in the flow.
Sample executions from a webhook
The following diagram demonstrates two simultaneous executions using a webhook flow:
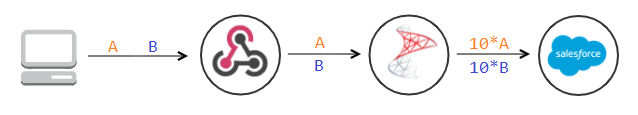
In this example, a client sent two messages to a webhook URL simultaneously.
-
Message
Apassed by the webhook trigger to the next action without change. While processing the message, the action produced 10 more messages which passed to the next action. The 11 messages, all produced by the same external stimulus, carry the same execution ID. -
Message
Bwas triggered by a separate external stimulus. It produced a second execution with another 11 messages. This execution is separated logically from execution A but not necessarily physically.
Sample execution from a polling flow
The following image represents a polling flow execution:

In this example, internal scheduling in the platform triggered a polling flow execution.
The message emitted by the trigger created a large number of messages that all belong to the same execution. In the example above 101 messages belong to the same execution and carry the same ID because they were caused by the same trigger message. A new execution is created in the next scheduling interval.
Executions page
Click Executions in the Analyze section of the main menu to access this page.
The page displays a list of the executions that have occurred on your platform. By default, the list is filtered to display all executions in the last 30 days.
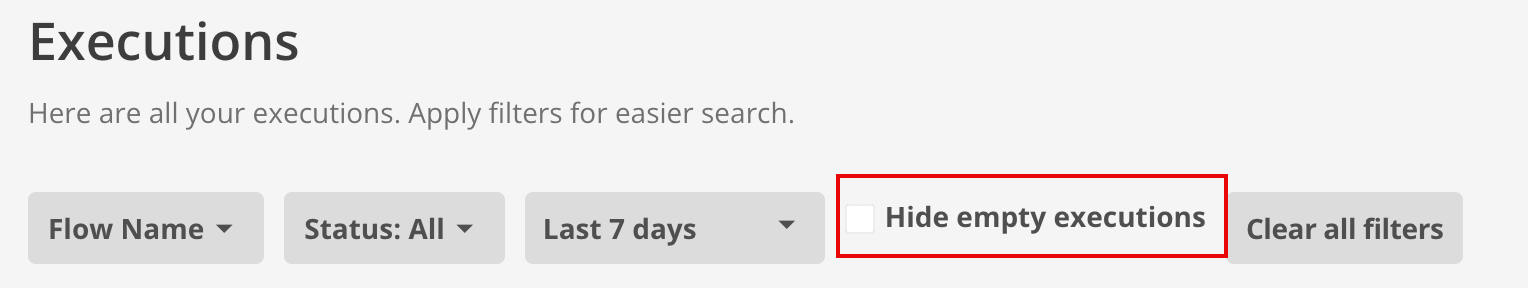
Filter by flow name, status or time to display the activity you want to monitor. You can use the checkbox to filter out empty executions.
| The platform adds all filters to the URL, so you can easily share your filtered view with a colleague. |
A notification displays at the top of the list if new executions happen while you are on this page. You can click Load them to load the executions or continue with your current data set without disruption. You can dismiss the notification by clicking X button without any impact on the executions.

If further executions occur after you dismiss the notification, a new notification will display with an updated count.
| To benefit from this page, all your custom components must use the latest Nodejs Sailor (above 2.5.4). Restart all the real-time flows after updating your components. |
Filtering
Choose to filter by one or more parameters to concentrate on specific flows or executions.
- By Name
-
-
Click the drop-down and use the checkboxes to select the relevant flows.
-
Type a flow name to find it in the list.
-
Click Clear to deselect all flows and return to the default view, showing all executions from active flows.
-
- By Status
-
This filter defaults to All but the user can choose:
- Successful
-
This filter only displays executions that ran successfully.
- Erroneous
-
This filter only displays executions that had errors.
- By Time
-
-
Use the interval/calendar filter to find executions from a specific timeframe which may span months or minutes.
-
Click Apply to apply the filter or Clear to discard all selections.
-
Debugging the executions
Since most of the errors inside components are related to the processed data, you can use this log to debug integration flows.
Click any execution in the list to open a visual representation of the flow. A red number displays on any step that has had errors indicating the number of errors that occurred at that step.
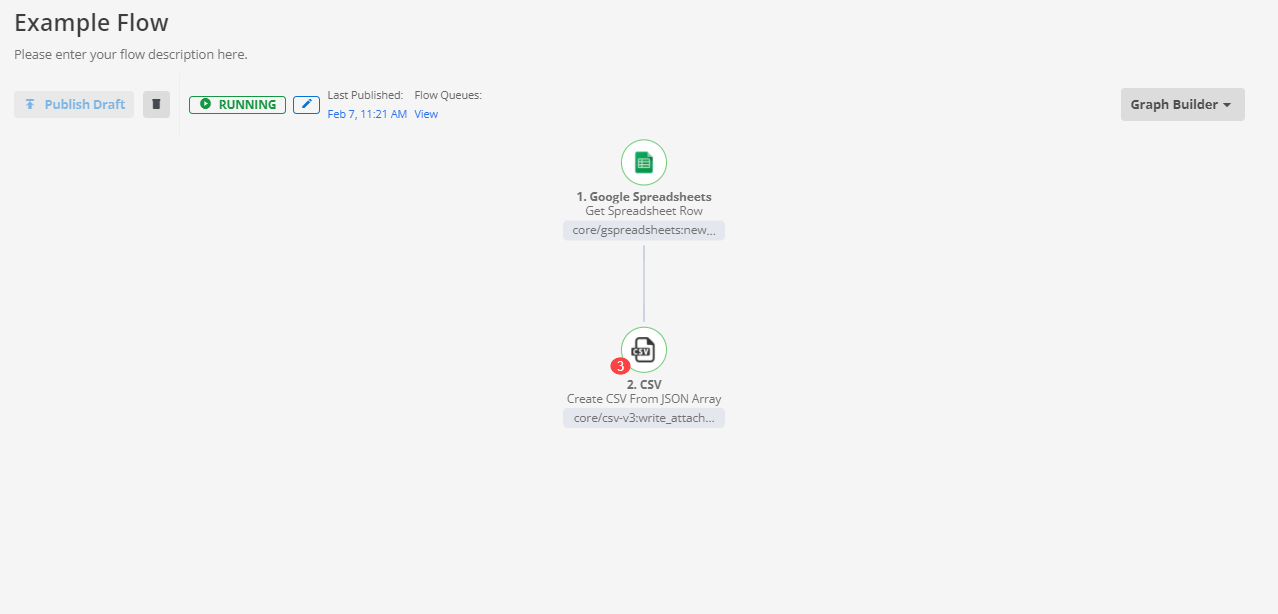
Click any step to view detailed logs for that step or to choose actions such as Retry.