About the UI
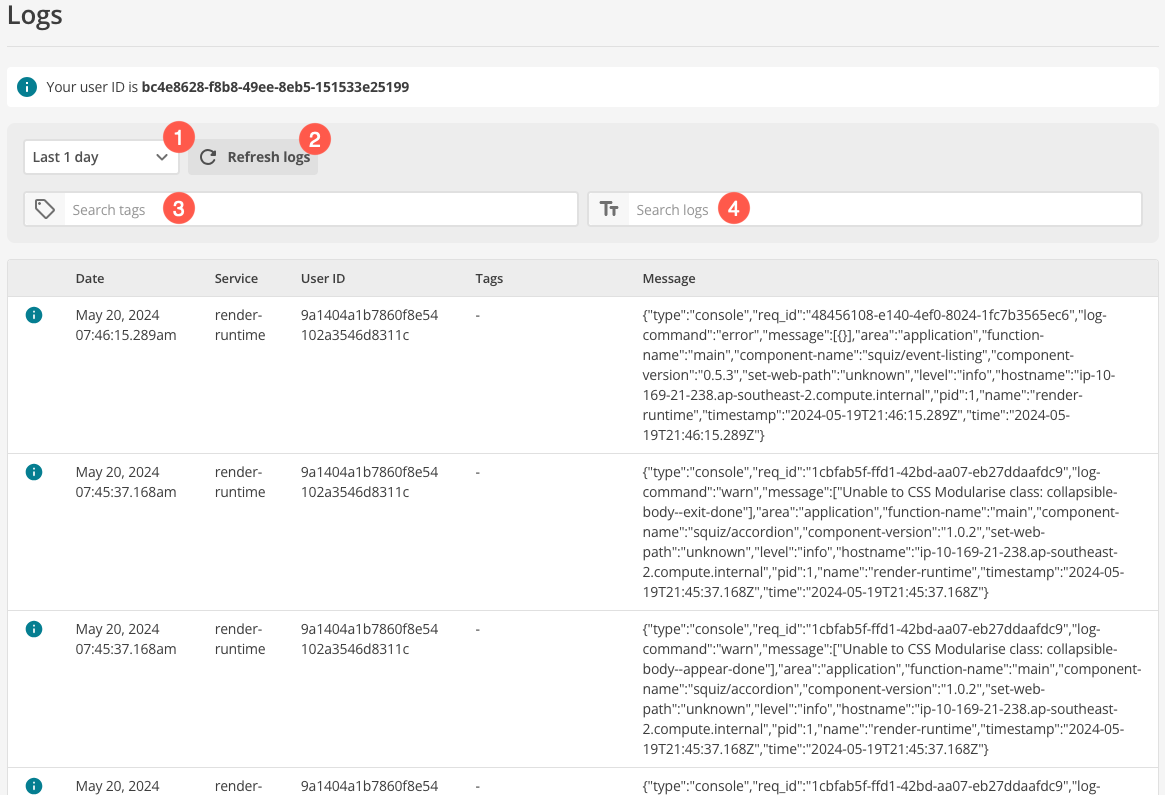
The Logs page lets you perform a free-text search across all logs for a given date range.
|
CMS, Integrations, and Search logs are not available in the DXP Logs service
The Squiz DXP Logs service does not cover CMS, Integrations, or Search logs. CMS logs can be accessed using the CMS Log Manager. Integrations logs can be accessed using the Integrations Logs Page. Search logging is documented in the Search Logs reference. |
You can then narrow the results shown by date and time.
The interface includes the following elements:
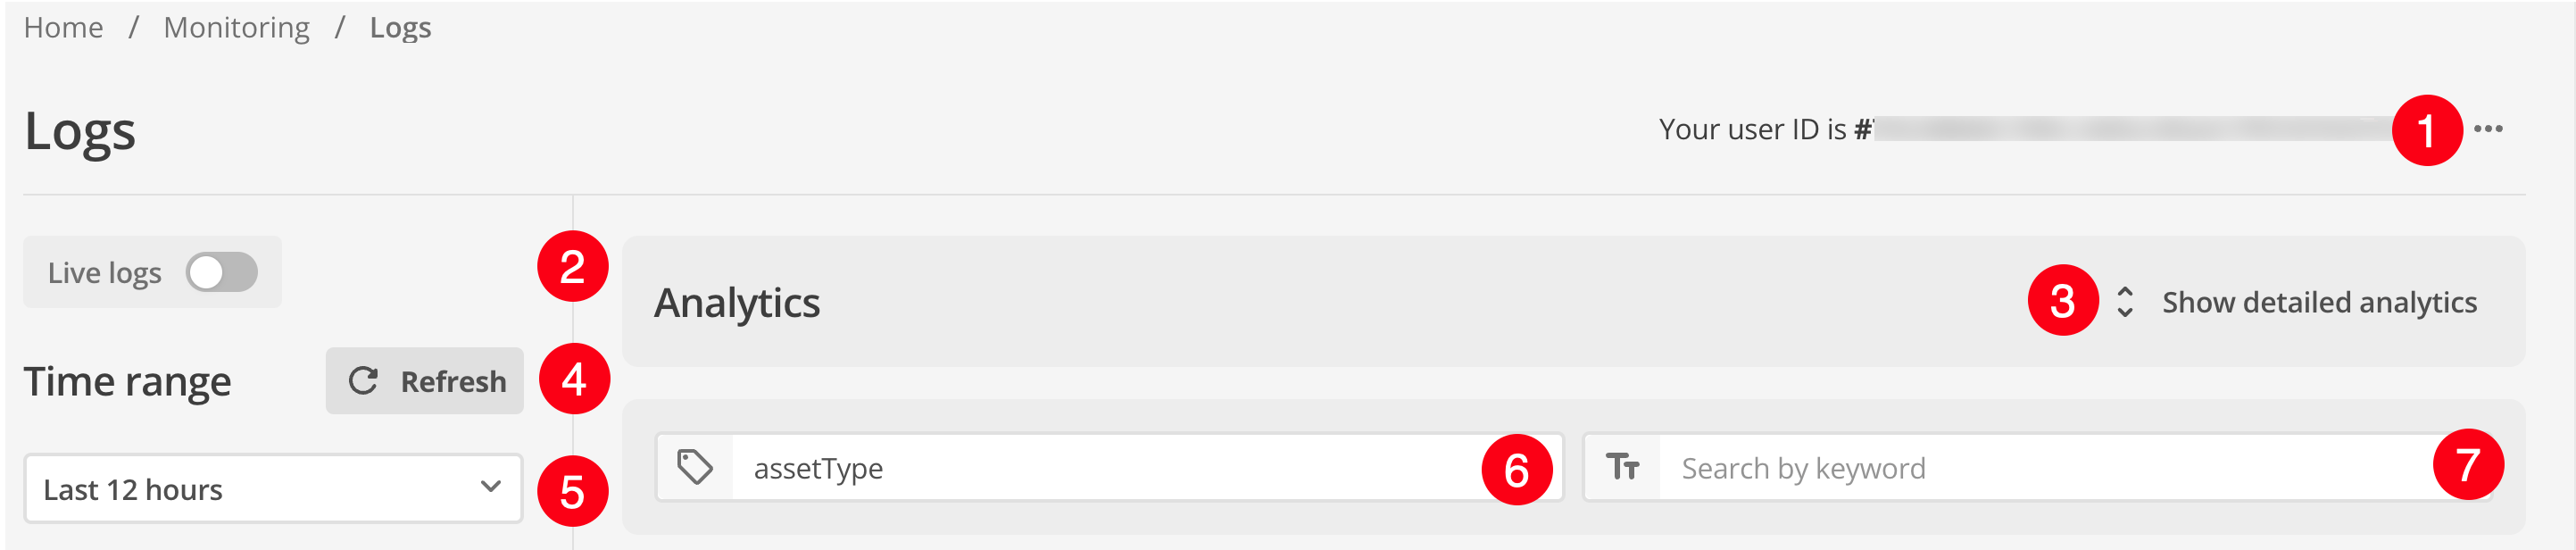
Top toolbar
-
Click the ⋯ menu to access additional configuration such as timezone, CSV exports, and setting up log streaming.
-
Turn on Live Logs to view logs in near real-time for live debugging and monitoring.
-
View a detailed graph of analytics data for the selected date range.
-
Refresh to update the latest log information shown.
-
Refine the number of logs returned by the available time precisions, or select a custom date range.
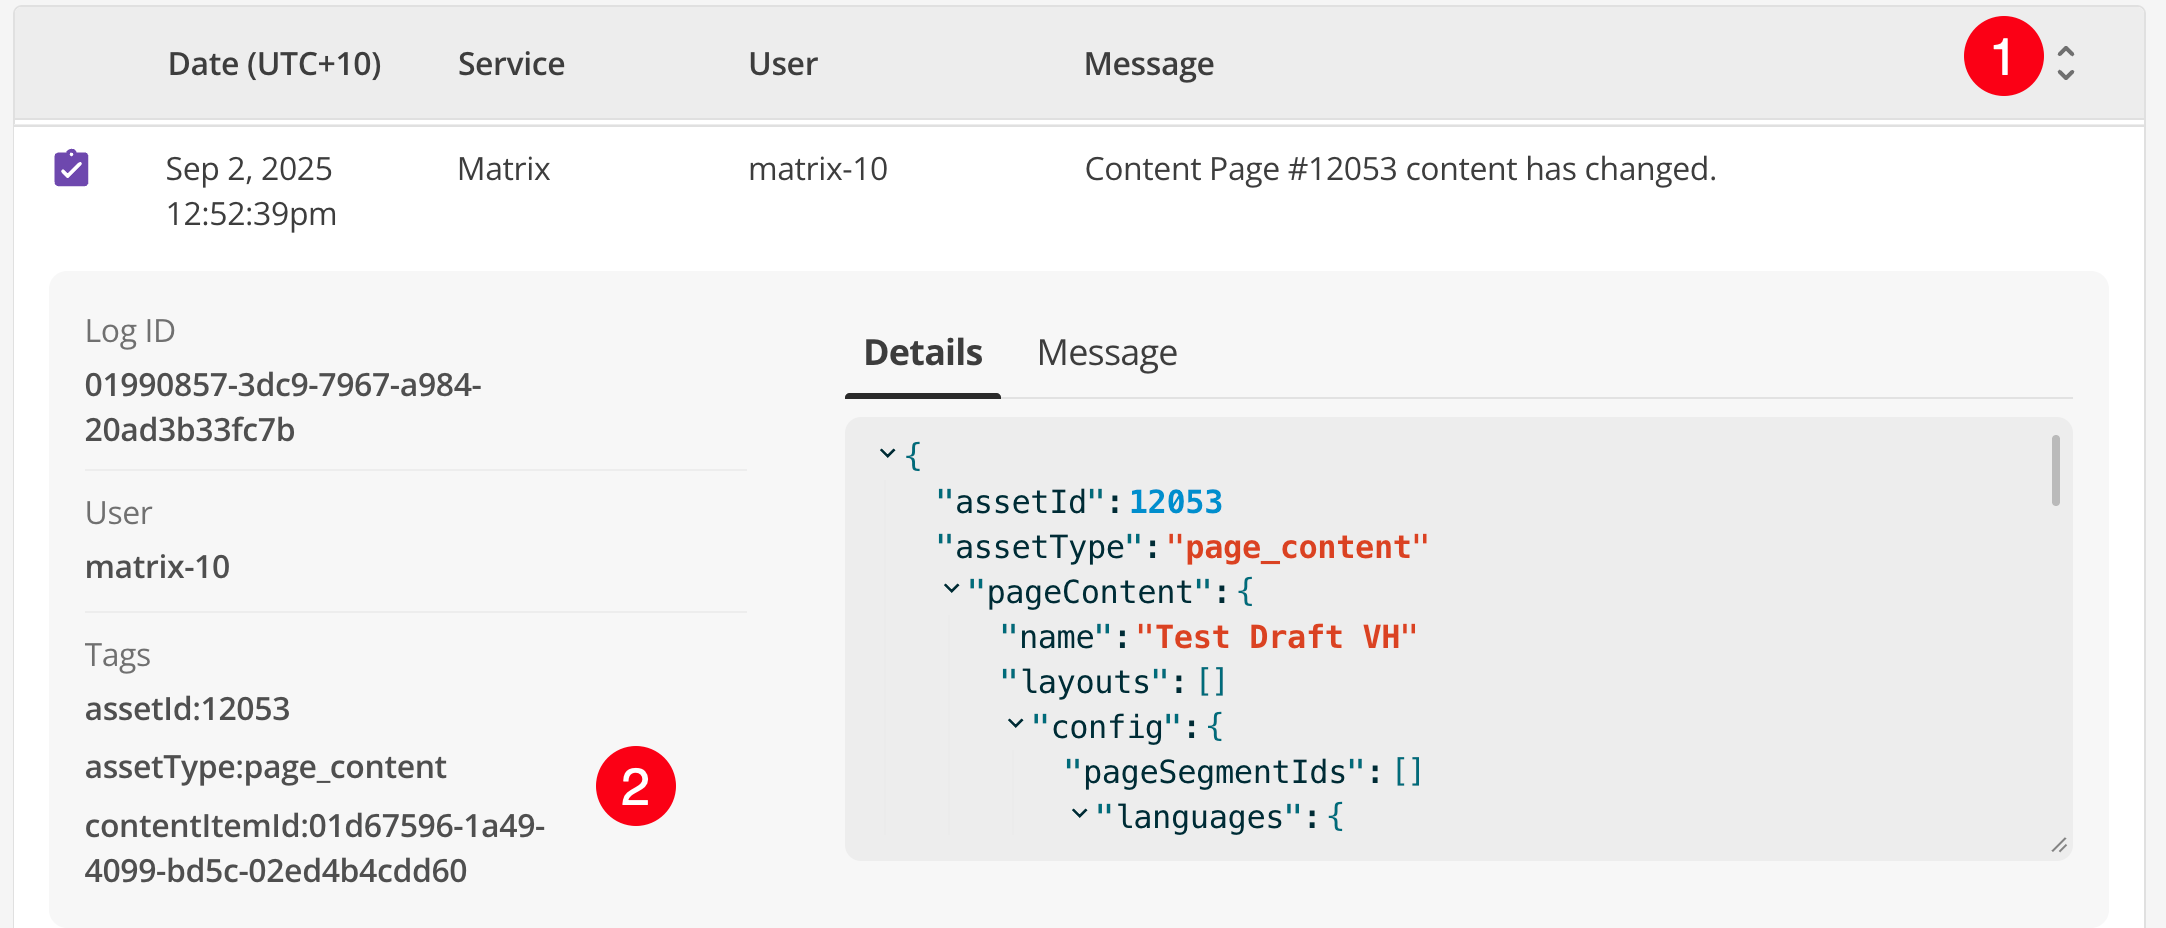
The date and time shown for each log entry is localized to your own timezone. -
Filter any user-tagged log entries generated by Squiz DXP services. Entering a tag into this field will enable the Other filter section as discussed in Filter controls.
-
Filter any keyword found across any column in the logs output.
Filter controls

-
Filter by log level (Info, Warning, Error, or Audit) for targeted searching.
-
Filter by service name to focus on specific DXP services.
-
Filter by other identifying features such as tags. This section is only visible when a tag has been entered into the search field in the top toolbar (
(4))
Read Refine log results using filters and search for more information about filtering.