About the UI
The Experience Monitoring Dashboard lets you view statistical information from those domains enrolled in monitoring.
-
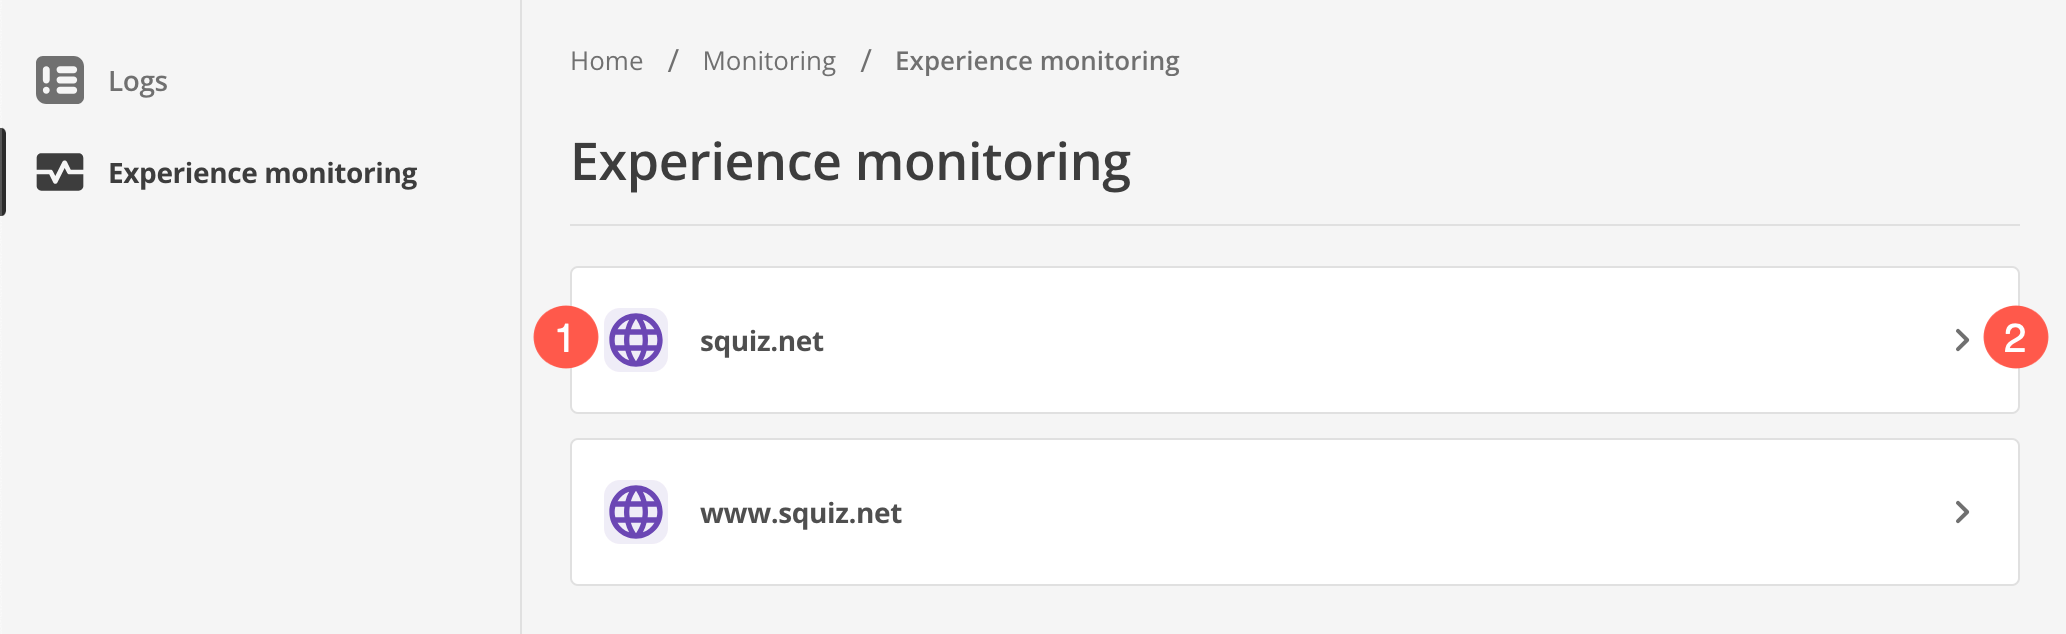
Each domain appears in the list.
-
Select
 to open the domain monitoring page.
Domain monitoring page
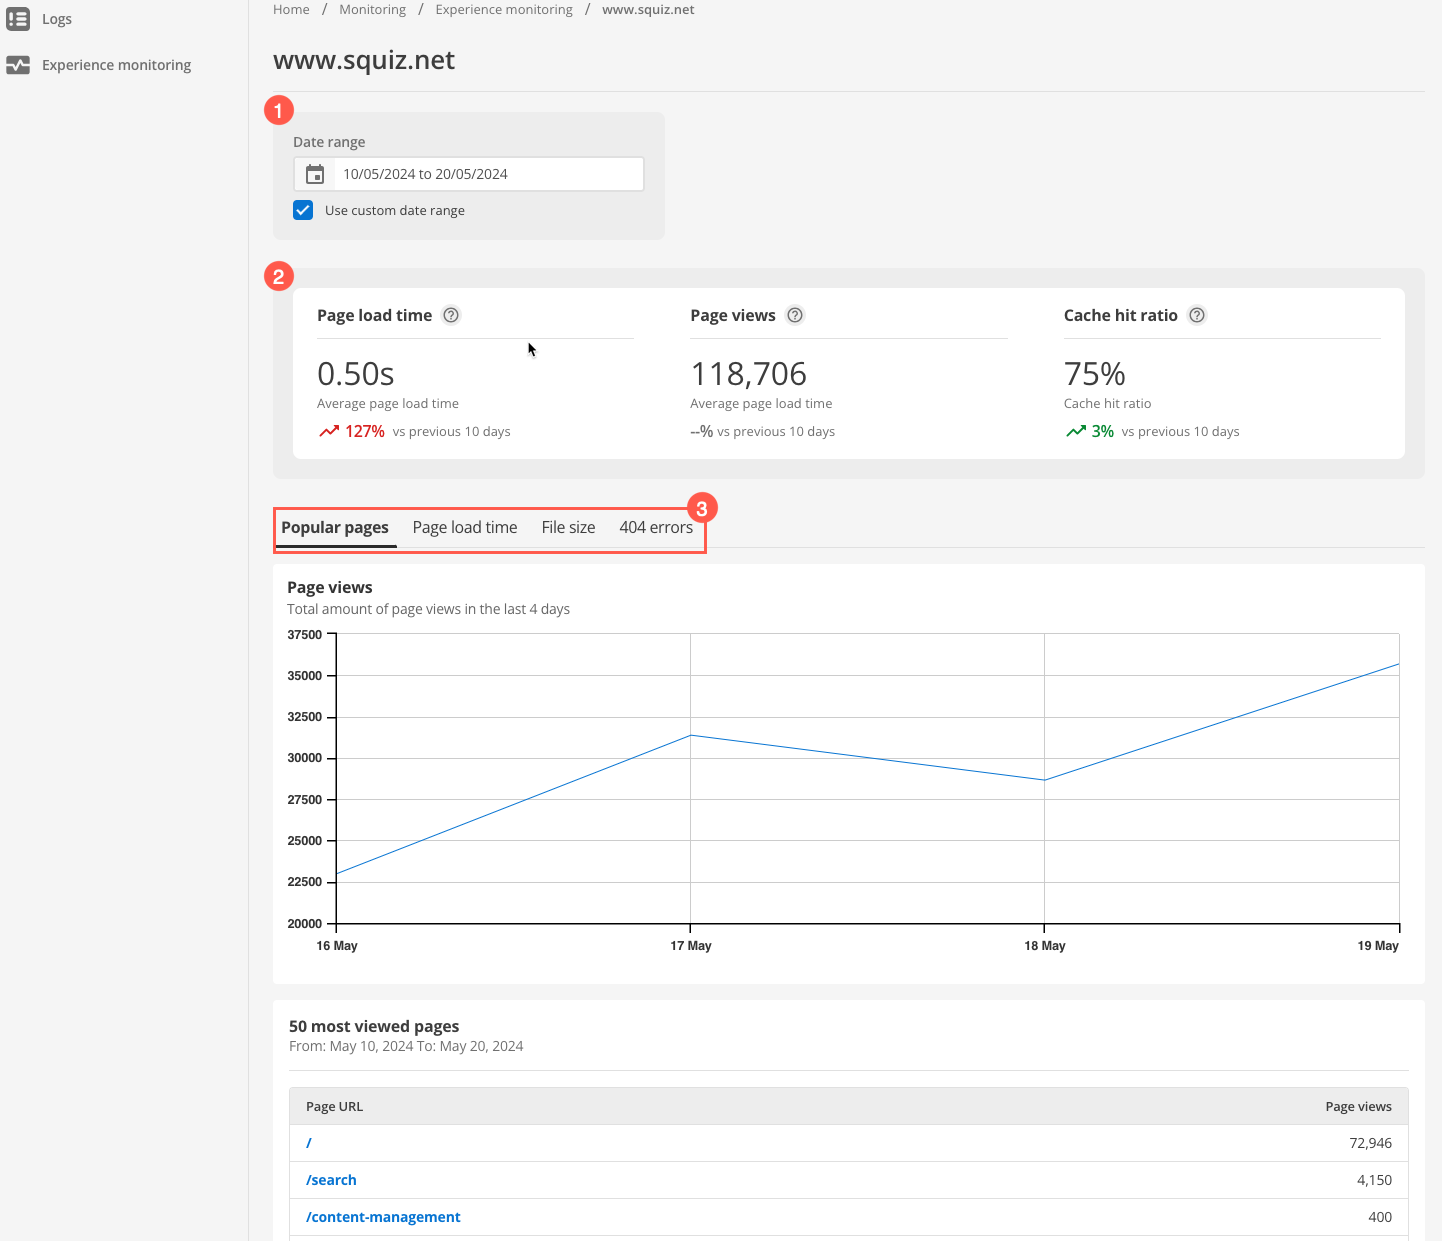
The domain monitoring page gives insights into your Content Management site’s performance.
-
Filter by date range by selecting a single date or a date range for which to show results.
By default, this field title presents as Date when first loaded. The field is also pre-populated with today’s date.
The field title changes to Date range when the Use custom date range checkbox is selected. When this checkbox is selected, the field’s pre-populated data also changes to a date range (yesterday to today).
-
View popular site statistics with trend information for the selected date or range of dates.
-
Browse Monitoring category tabs for insights into site performance.
|
When first loaded, the Experience Monitoring Dashboard shows the data collected for the current day. If not enough data has been collected at the time the page is loaded, a notice to this effect presents in place of popular site statistics. |
Read more about what each tab can help you resolve with your site in the Using Experience Monitoring section.