Segment insights
|
If you can not see the Single Customer View (SCV) options in your Squiz DXP organization, this often means that your user account does not have the CDP Data Agent secondary role applied. You can ask a DXP Owner in your organization to add this secondary role to your DXP user account. |
Segment insights are data-driven analyses about specific customer segments, such as behaviors, preferences, and engagement patterns.
To access the Segment insights view:
-
Select Segment insights from the menu.
-
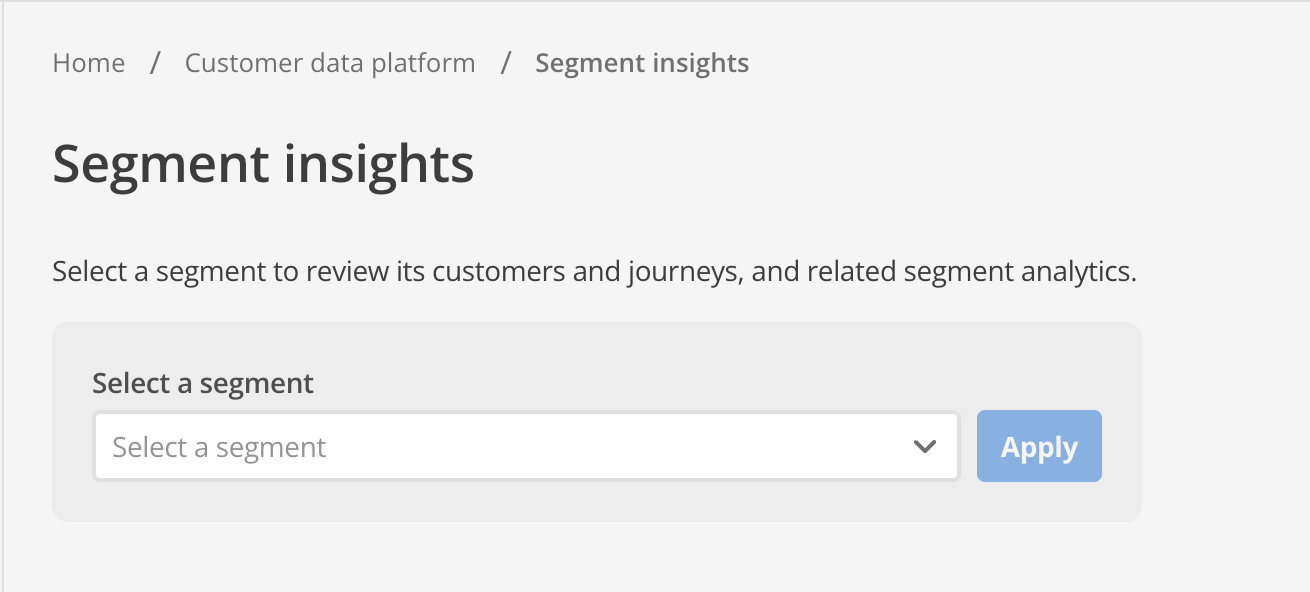
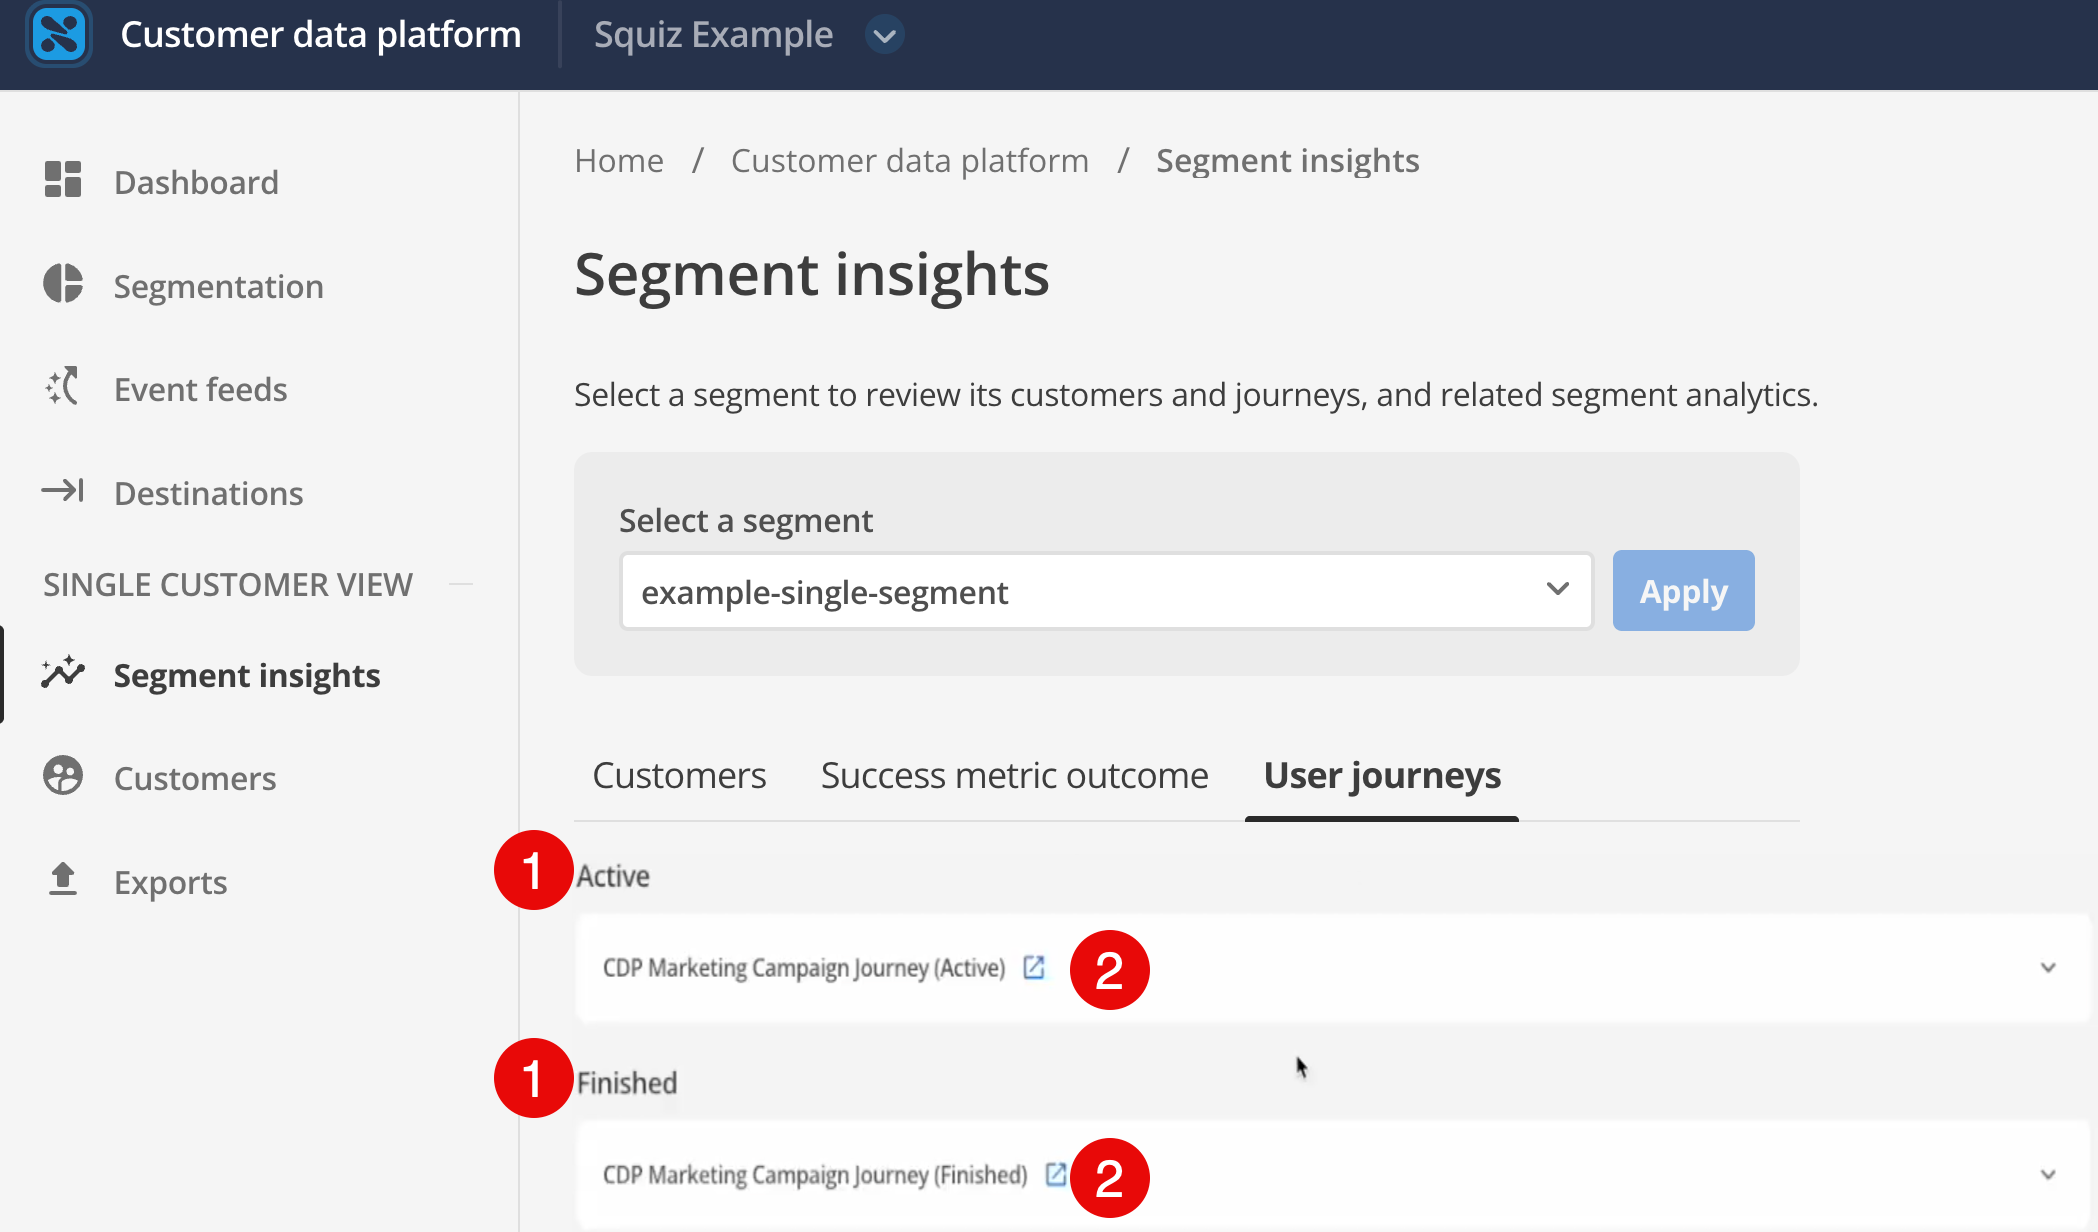
The Segment insights page appears:
-
Select a segment from the expandable menu.
-
Select Apply.
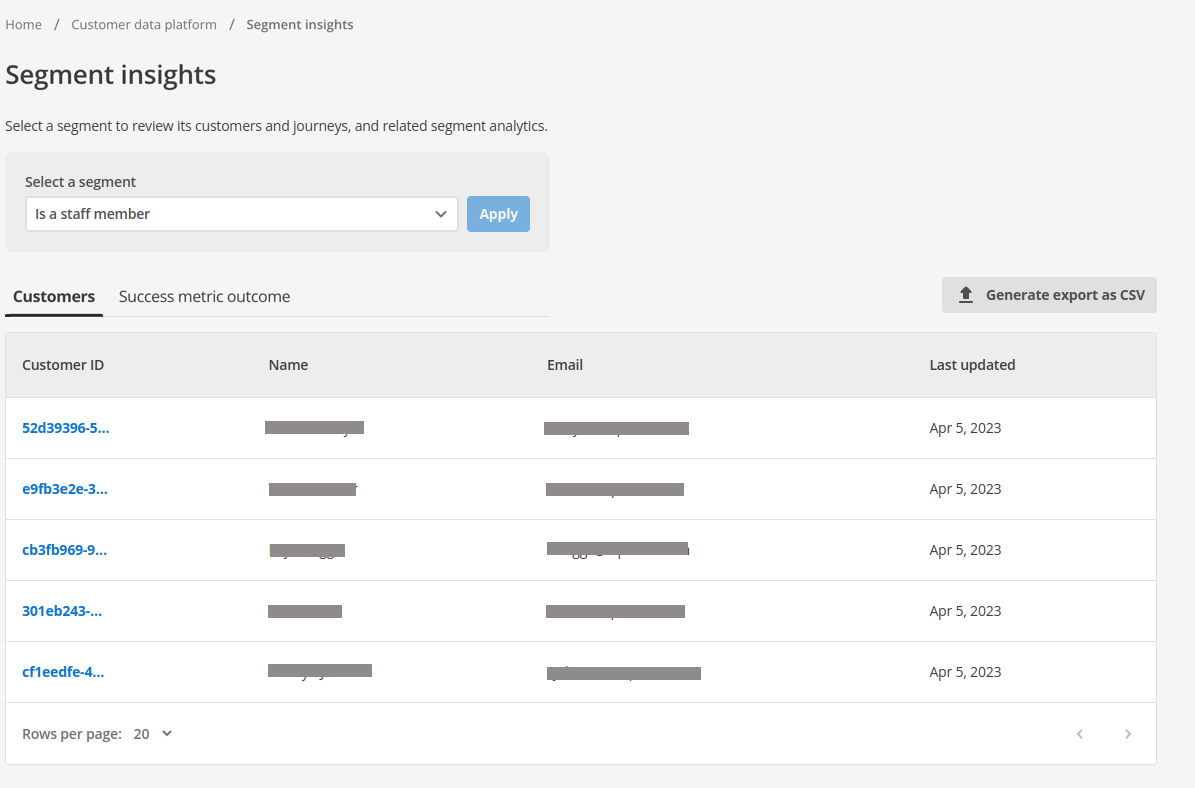
The view displays data for the selected segment in two tabs: Customers and User journeys.
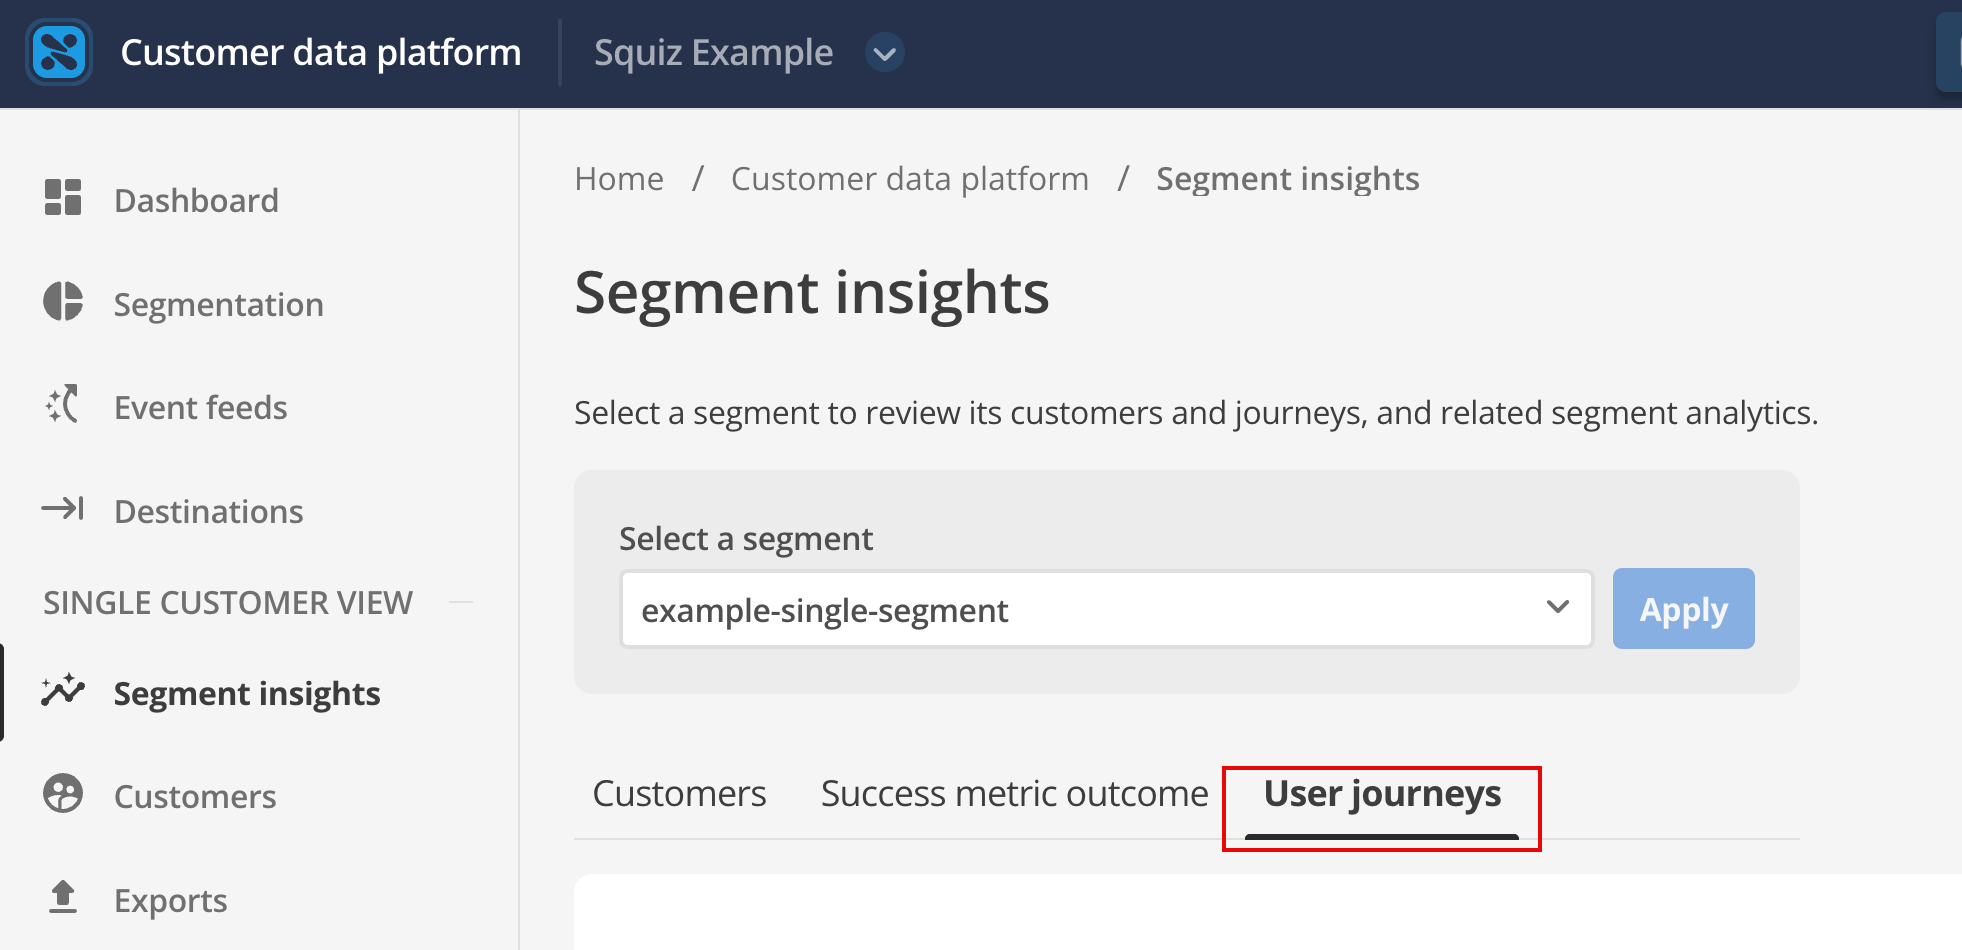
User journeys tab
The User journeys tab visualizes how customers in this segment interact with defined user journeys.
Selecting this tab displays a list of available journeys.
Journey list
The journey list displays all user journeys relevant to the segment.
-
Journeys are categorized as either Active or Finished.
-
Click the Configuration link next to a journey to view its setup.
Journey visualization
Select a journey from the list to view the analysis. This opens a Sankey-style chart that maps the flow of the specific segment across key "track pages" (nodes).
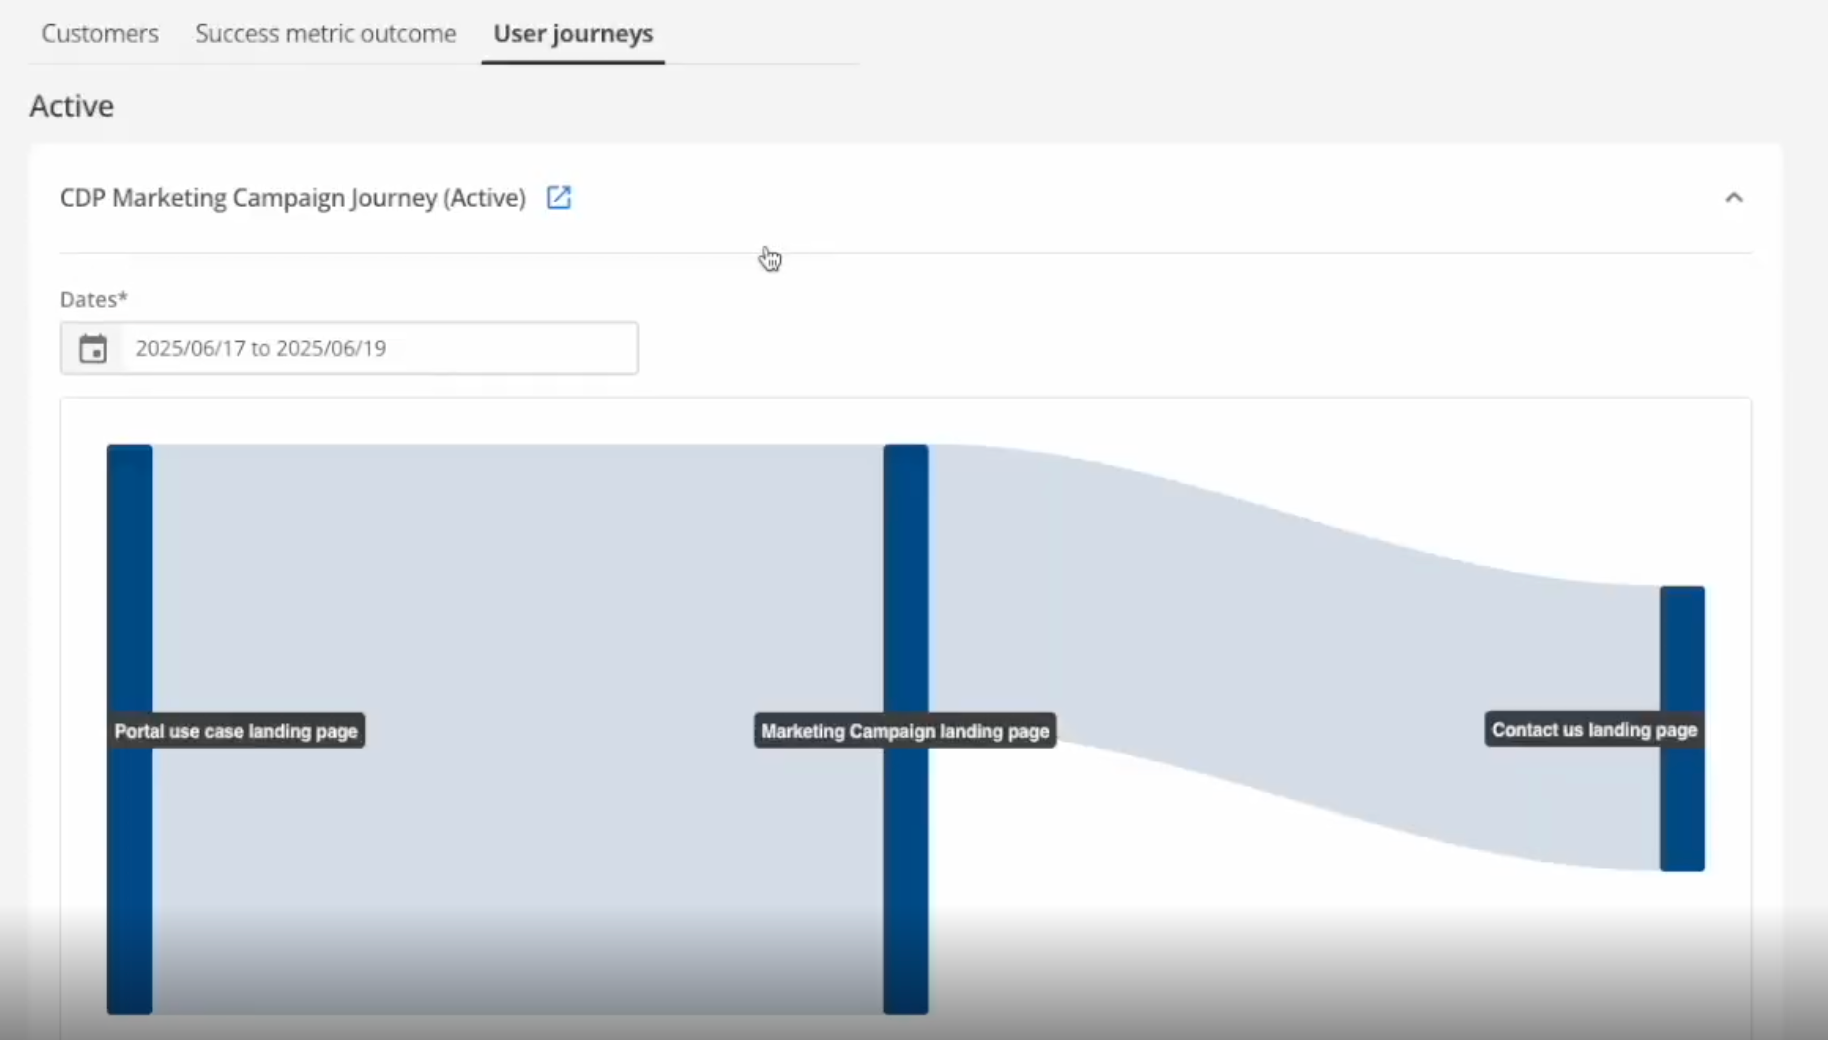
| This view represents a subset of the total user journey data, specifically filtered to the users in your selected segment (for example, "User Journey Mapping Demo Search Segment"). |
Use this visualization to understand performance and identify drop-off points.
Tooltip metrics
Hover over a specific page or node in the journey flow to view detailed metrics:
- Label
-
The name of the selected section.
- Drop-offs
-
The number of users exiting the journey at this point.
- Average time spent
-
The average duration users in this segment spent on that specific page.
- Visitors
-
The raw count of unique visitors from this segment to that page.
- Percentages
-
The proportion of users relative to the total user base.