Reviewing the results
After a path is created and made active, User Journey Mapping starts tracking users immediately. It collects data on users who
-
Start but do not complete the path.
-
Users who start on the defined path, stop at some point along said path, and take no further trackable actions for 120 minutes (2 hours) after stopping.
-
-
Complete the path.
-
Users who complete all the defined path steps, stop at the defined end-point, and take no further trackable actions for 120 minutes (2 hours).
-
-
Complete the path and go further.
-
Users who complete all the defined path steps, then take further trackable actions less than 120 minutes (2 hours) after path completion.
-
However, the path preview page only updates results every hour.
You can monitor results while the path is active or let it run for a defined period and view the results after it ends.
|
The results of a finished path are only retained for three months. To retain a copy of these results, a PDF report is available to download. |
-
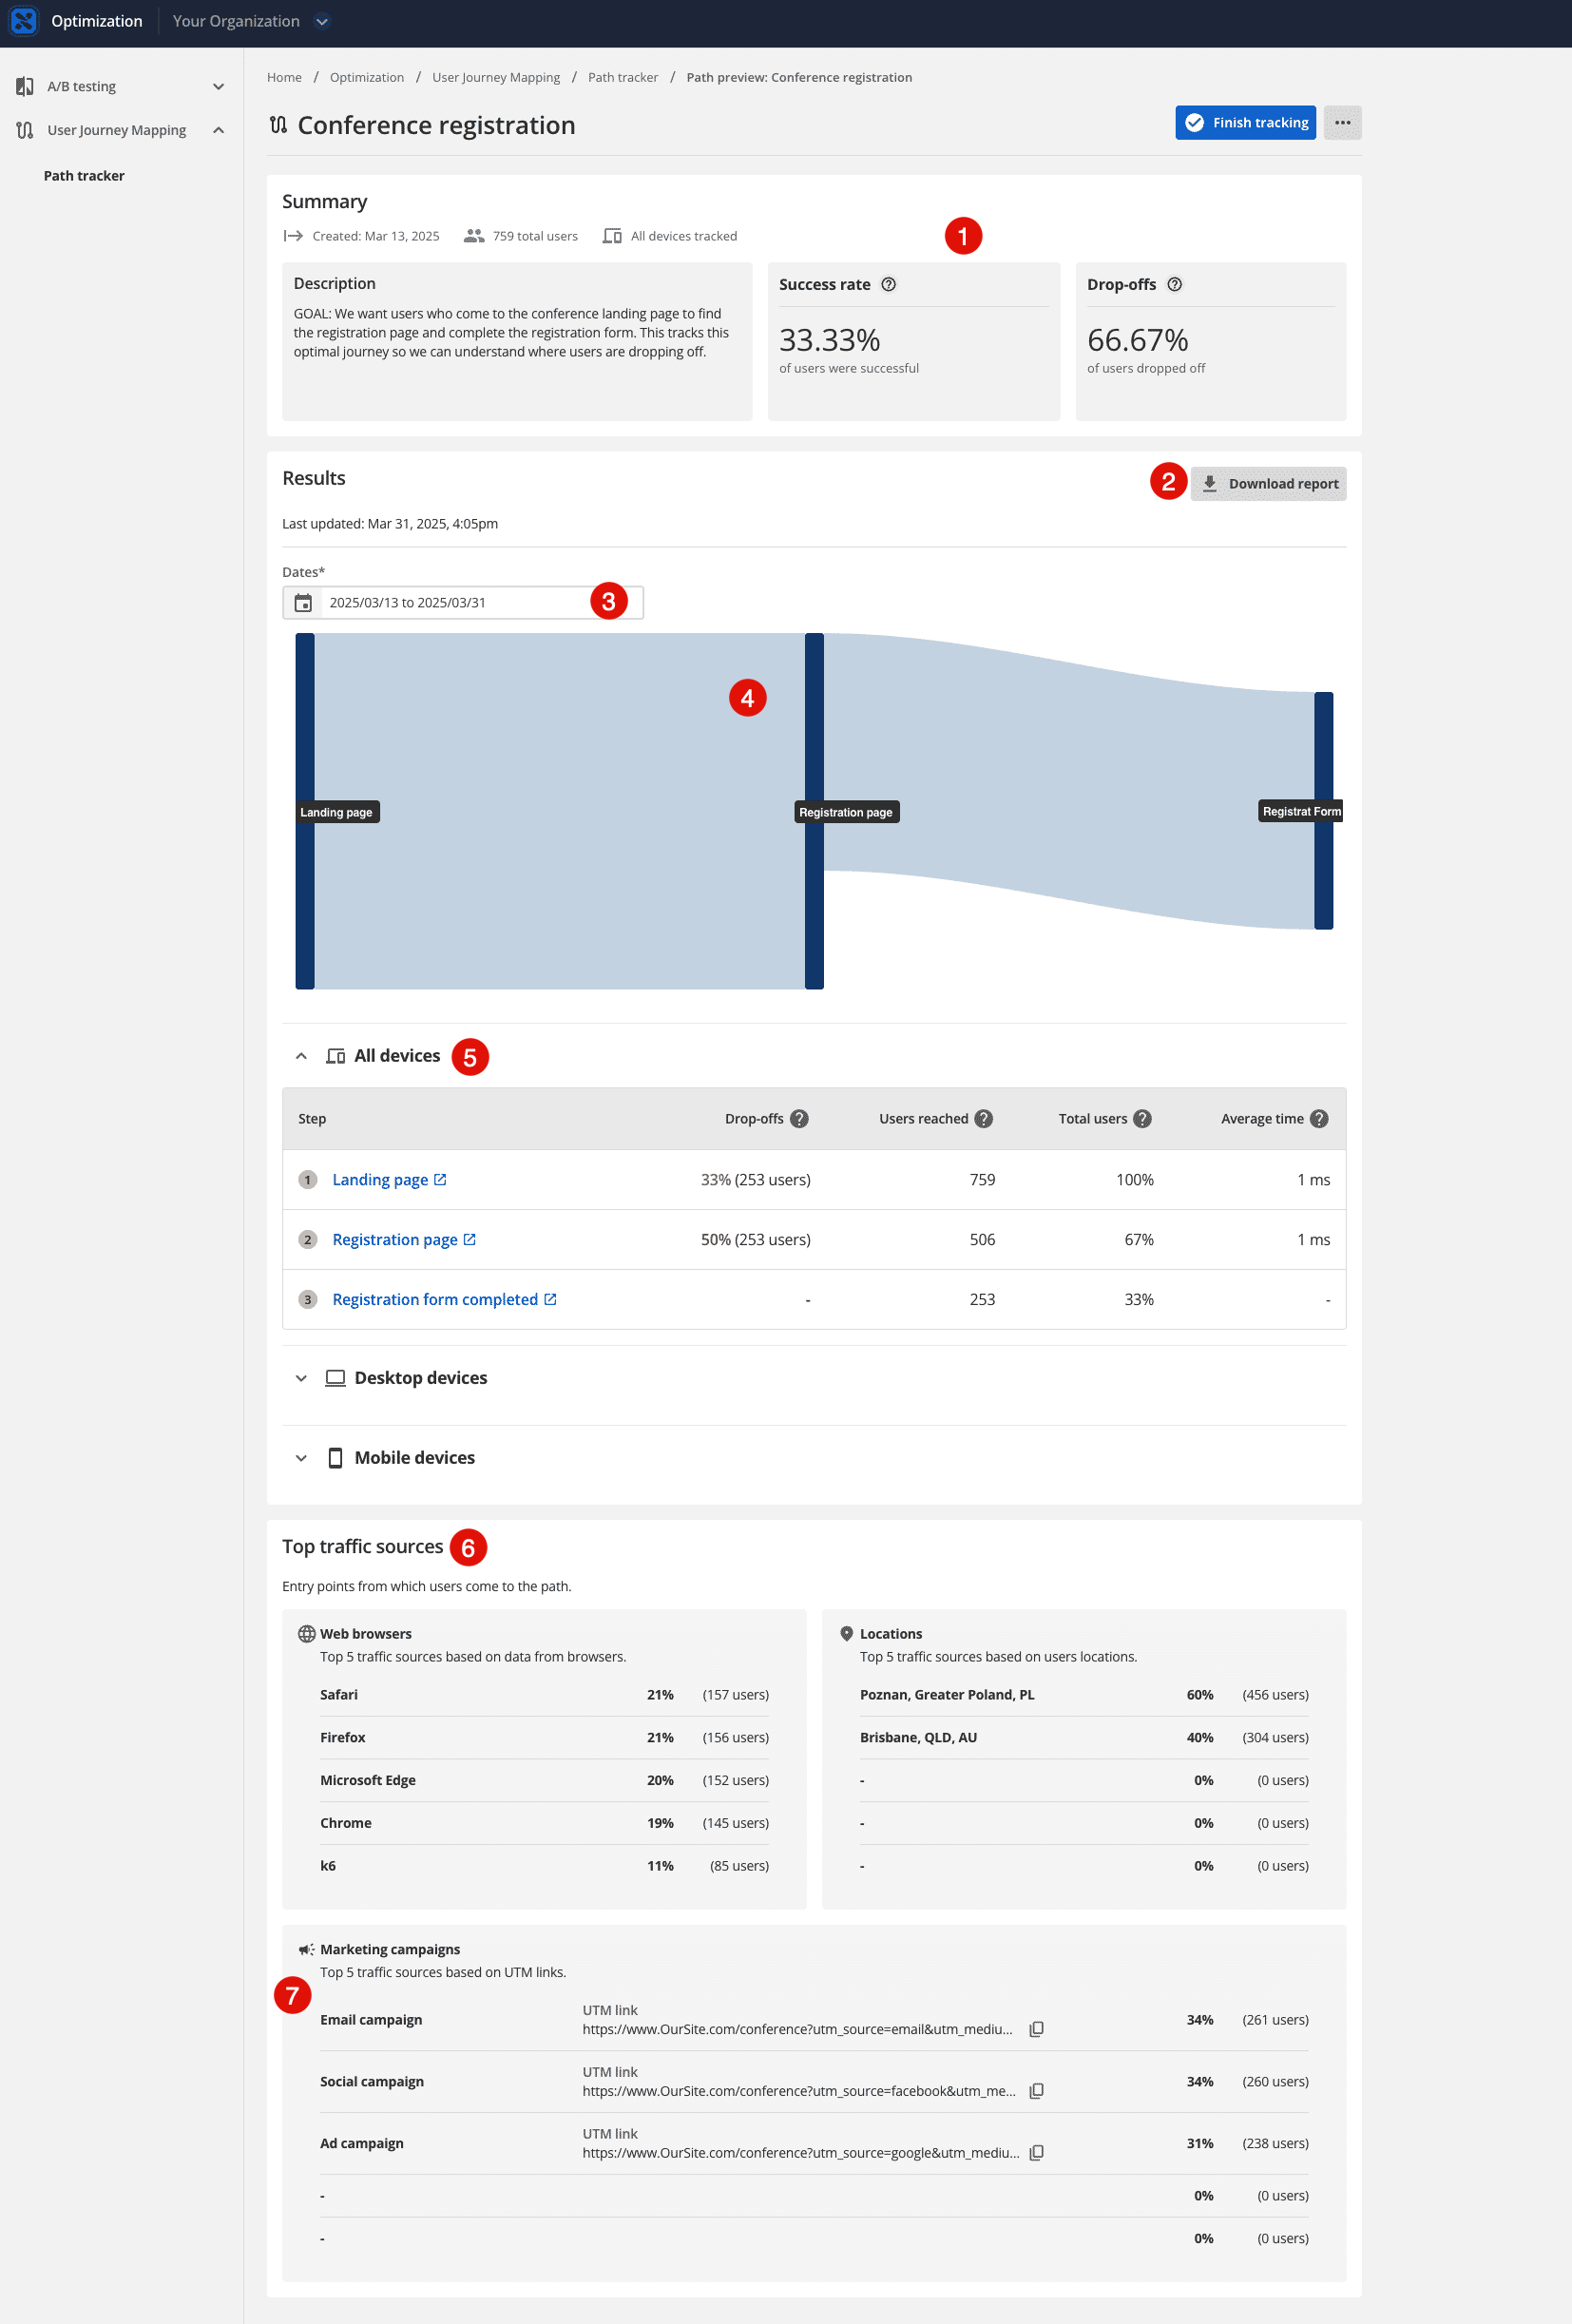
This is a summary of the path’s performance, showing when it was created, the total number of users who visited at least the first step of the journey, the success rate (the percentage of users who reached the final step), and the overall drop-off rate (the percentage of users who did not reach the final step).
-
You can download a PDF report of your result from here.
-
You can select a specific date range to see data specific to that period.
The Dates field does not accept direct text entry. A mouse or equivalent pointer control (including Mouse Keys) must be used.
To select a date range:
-
Click on the current range to open the calendar;
-
Click on the date at the beginning or end of the desired date range;
-
Drag out across the calendar to the other end of the desired date range.
-
Click on the date at the other end of the desired date range.
The graph and data refreshes to represent results for your selected date range.
-
-
You can see a visual representation of the steps and drop-offs.
-
You can choose to see traffic data from all devices (desktop and mobile devices) or choose either modality by expanding the appropriate accordion heading.
-
The Top traffic sources section displays information about users when they enter the journey.
-
You can see the performance of traffic originating from specific marketing campaigns by using UTM parameters in the links that direct users to the start of the tracked journey.
Understanding the results
When you have some data, you can use this information in many ways:
- Overall performance
-
Understand the overall performance of the journey by looking at the summary information, such as the total number of users who started the journey, the success rate, and the overall drop-off rate.
This gives a high-level view of how effectively the path guides users towards the desired outcome.
How does the success rate of this path compare to similar paths?
- Identify drop-off points
-
Where are users abandoning the journey? High drop-off rates at a particular step indicate a potential issue or pain point that needs to be investigated and addressed.
In our example, 506 users arrived at the second step (the Registration page), but at that point, 50% of them abandoned the journey.
- Analyze user behavior
-
By examining the number of users entering each step (users reached) and the average time spent on the step, you can gain insights into how users interact with the content and the journey flow.
Long times spent on a particular page before dropping off might suggest confusion or difficulty, while low engagement could indicate a lack of relevant information.
- Review traffic sources
-
Information about browsers, device types (desktop/mobile), and user entry points can provide context to user behavior.
For example, a high mobile drop-off rate might suggest the need for mobile-specific optimizations.
Understanding which campaigns are driving the most successful users to the start of your path could help inform your marketing strategy.
In our example, we have many Polish visitors. We could likely improve our success rate by personalizing content for this audience.
Optimizing your site
As areas for improvement are identified, you can plan and implement changes to your website.
This might include:
-
Making adjustments to content and design
-
Simplifying navigation.
-
Addressing technical issues.
A/B testing
A/B testing (also known as split or bucket testing) compares two variants of something (for example, a webpage) to determine which performs better.
The test is an experiment where you show variants "A" and "B" to different users and see which performs better.
A/B tests are configured and managed in the Optimization capability; this is where the test results can be viewed.
In Content Management, you can connect the test to a particular content page and create the two variants of content that form the basis of the test.
You can learn more about A/B testing in the Squiz Help Center
Personalization
Content personalization lets you target content to specific audience segments browsing your site.
Showing users personalized content can increase engagement, provide a more efficient and enjoyable user experience, and increase conversation rates.
Segments are centrally managed through your Squiz DXP organization’s Customer Data Platform (CDP).
In Content Management, you can apply personalization to specific content on a page to tailor the experience for available segments.
You can learn more about Personlization and the CDP in the Squiz Help Center.