View A/B test results
A/B testing results
A/B test results
Live A/B test results are displayed within the test’s configuration page.
-
Navigate to the page from , then use the filters or a search to locate the test.
-
Click on the specific test entry to open the test’s configuration page.
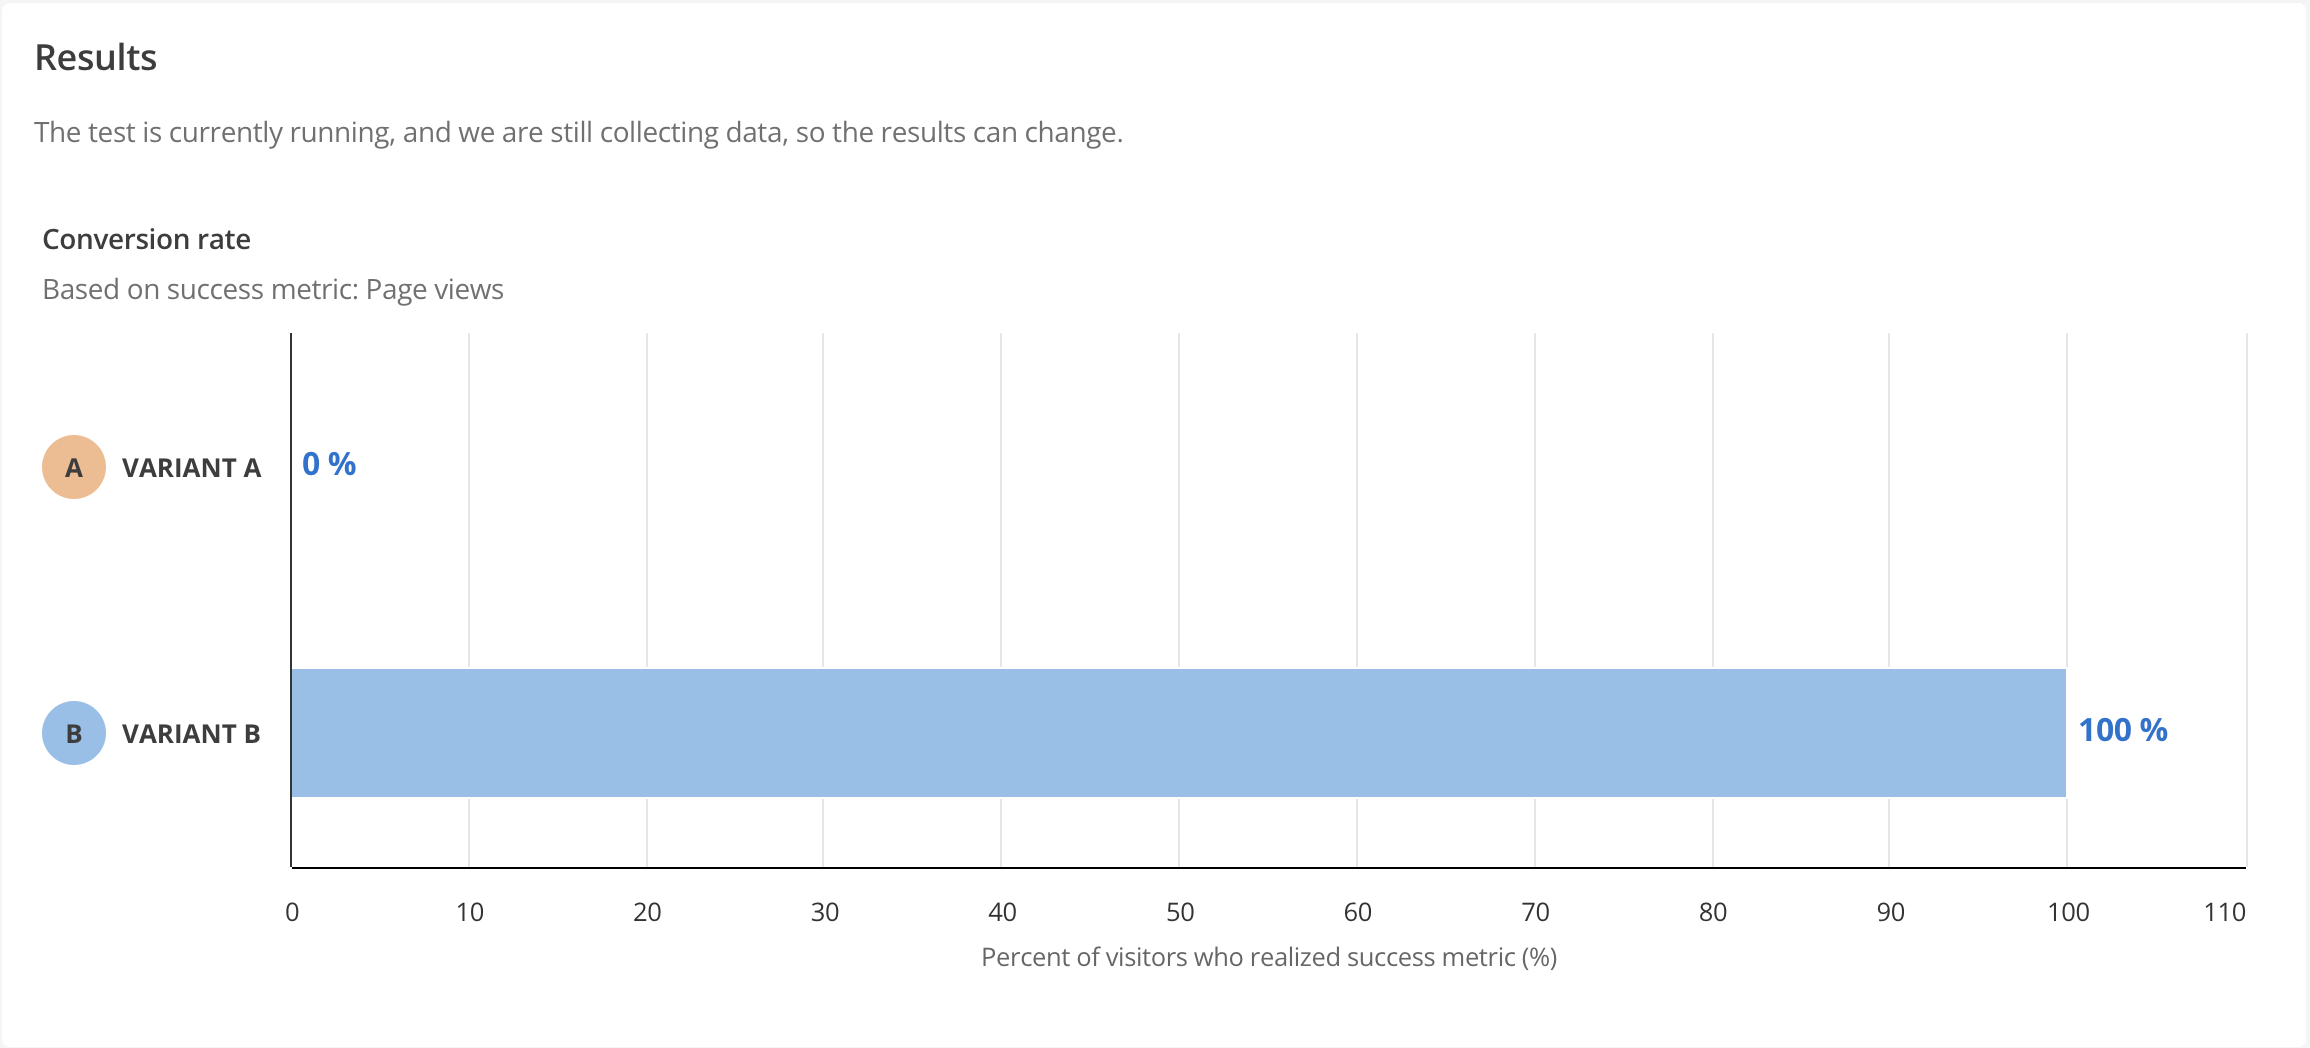
The Results section displays (below the Summary section).

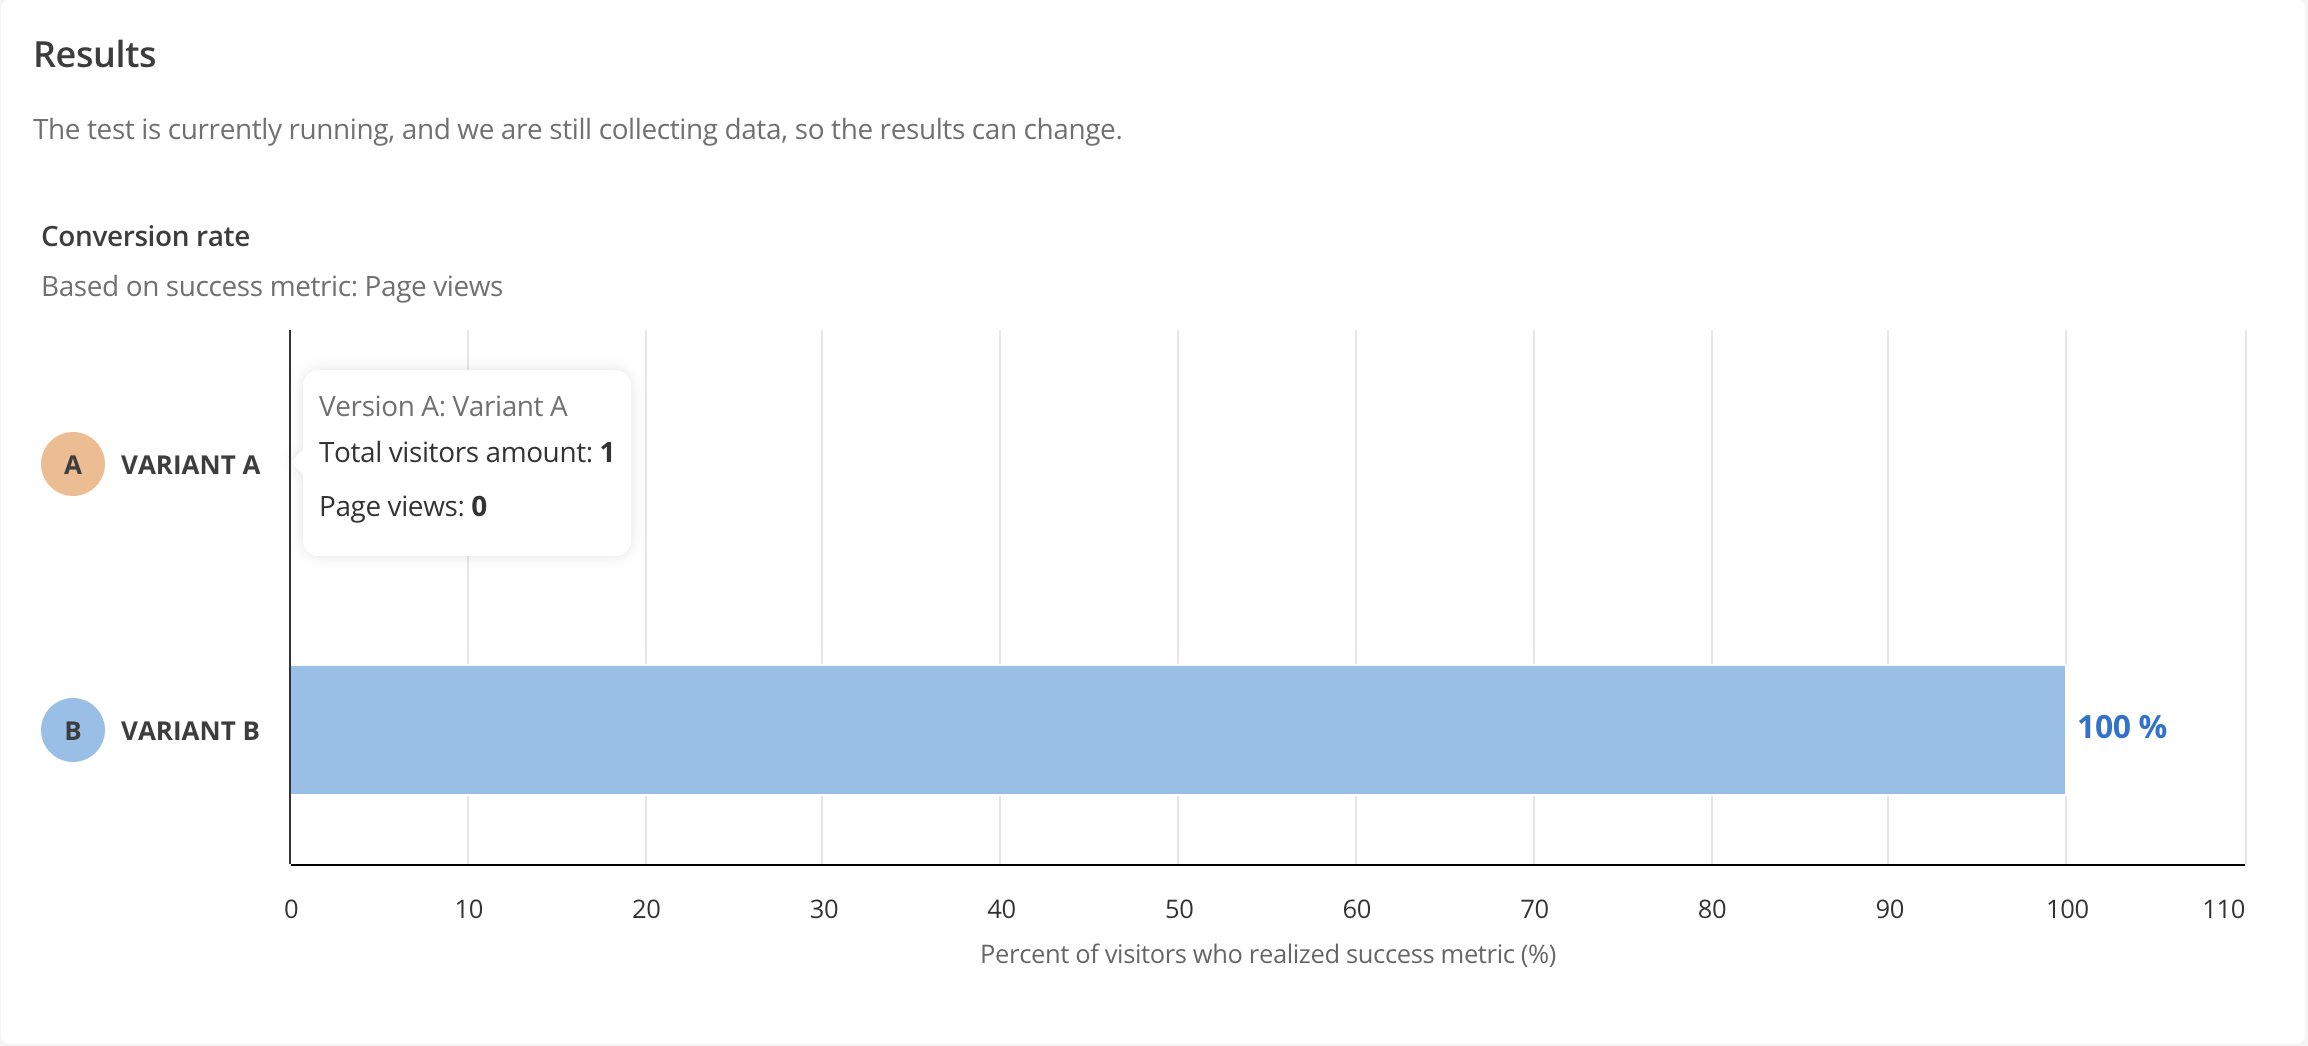
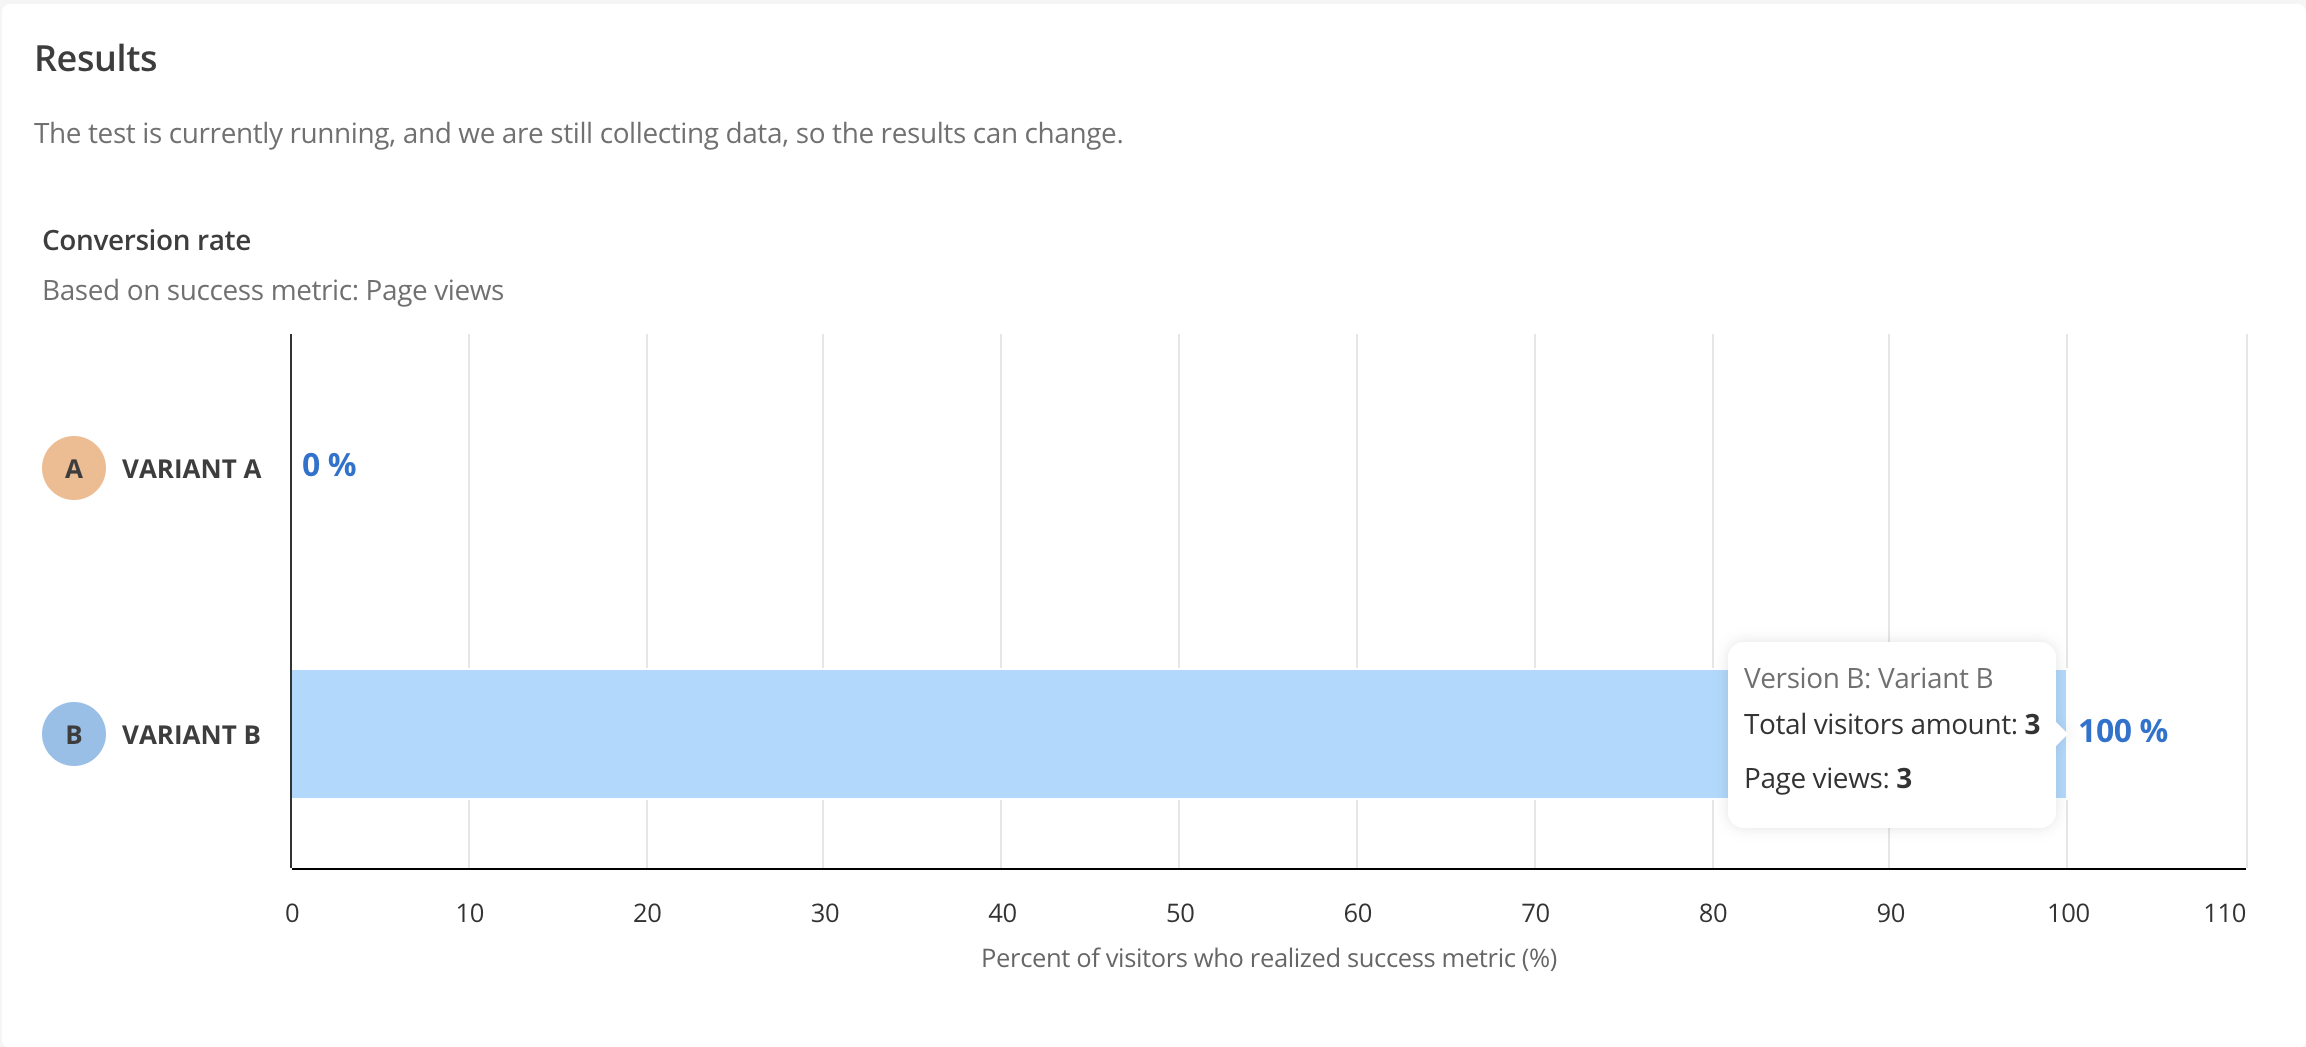
Further information is presented when a pointer hovers either of the results bars.
For example, a running A/B test presenting results:

Hover the pointer over the Variant A results bar, and a pop-up presents:

Hover the pointer over the Variant B results bar, and a pop-up presents:

In both pop-ups,
-
the Total visitors amount is the number of times the variant page was viewed; and
-
the Page views is the number of times the success metric was achieved.
|
A/B test results are based on unique sessions. Also, A/B test results presented in the DXP Console are updated approximately every eight hours. |
If an A/B test is connected to multiple content blocks, the test results represent the success of a variant set in driving the stated success metric.
They indicate whether variant A set or variant B set is more successful.
You cannot measure how one of the content blocks performs against another. To test at that level of granularity you must run an A/B test specifically on that content block.
Export a PDF report
Once your A/B test is finished you can choose to save your test results.
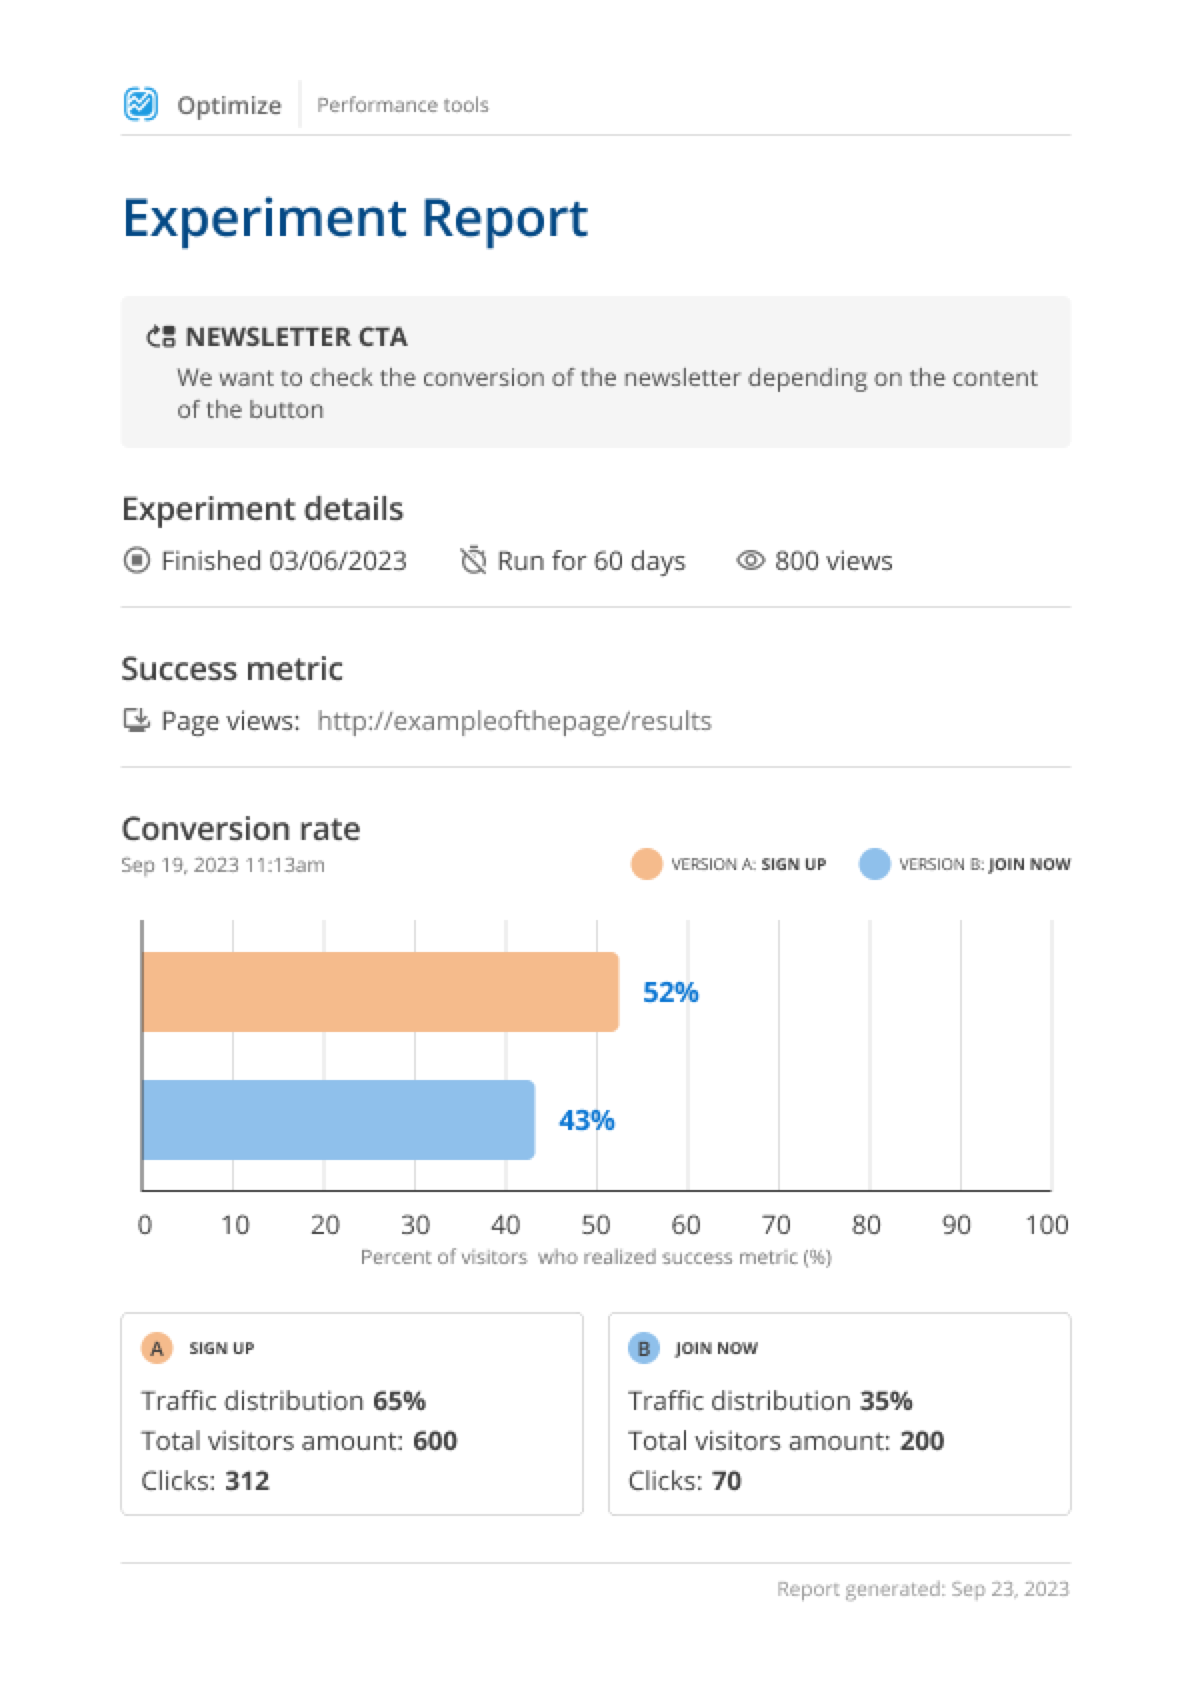
Click the Download report button to download the A/B test results as a PDF.
The report includes a summary, basic details on the test and the success metric.
The report presents a comparison of the conversion rates for the two variants that were tested.

|
The Download report button presents immediately an A/B test is finished. When an A/B test is finished, all the data generated by the test has been processed by the test. However, in some cases, the metric service is still processing some metrics even though the A/B test itself is done. In such a case, A PDF generated before the metric service is done processing will present different information than a PDF generated after the metric service is done. |
Implementing the findings
The results of the A/B test will provide you with information that can be used to decide if you wish to implement either of the variants, or to perform a new test.
At this point you could choose to implement variant A on your site, or you could run a new A/B test comparing variant A to a further variant to further optimize the experience.
The basic steps to implement the successful variant on your site are summarized as follows:
-
Open the content page asset that contains the A/B test.
-
Add a component to the content page that matches the A/B test component.
-
Copy over the content from the test variant that yielded the desired result.
-
Delete the old content component that contained the A/B test.